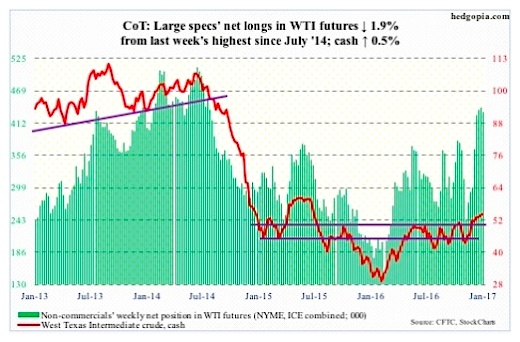
The following is a recap of the January 6 COT Report (Commitment Of Traders Report) released by the CFTC (Commodity Futures Trading Commission) looking at COT data and futures positions of non-commercial holdings as of January 3.
Note that the change in COT report data is week-over-week. Excerpts of this blog post also appear on Paban’s blog.
3 Charts Highlighting Speculative Positions in Crude Oil, Gold, and the US Dollar
Crude Oil – Spot West Texas Intermediate crude oil began 2017’s first regular session with a bang, only to end with a whimper. At one point on Tuesday, crude oil was up as much as 2.8 percent to $55.24 – the highest since July 2015 – but closed the session lower 2.6 percent, in the process producing a massive outside reversal candle. In the next three sessions, crude oil rallied to offset that decline. Bulls continue to defend $52.
That said, risk/reward odds favor weaker price in the weeks ahead. On the weekly chart, the cash has produced dojis for the five straight sessions, with not much progress in the past four.
The EIA report this week was a mix of both good and bad.
Crude oil stocks fell by 7.1 million barrels to 479 million barrels – a 10-week low. Crude oil imports fell, too, by 984,000 barrels per day to 7.2 million b/d – also a 10-week low.
Refinery utilization rose a point to 92, matching the reading of mid-September last year. However, gasoline stocks jumped 8.3 million barrels to 235.5 million barrels – the highest since late July last year. And, distillate stocks jumped 10.1 million barrels to a 14-week high of 161.7 million barrels.
Crude oil production rose a tad, up 4,000 b/d to 8.8 mb/d.
January 6 COT Report Data: Currently net long 431k, down 8.2k.
Next COT chart (Gold)…


