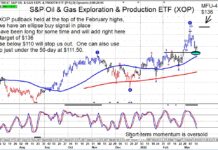
Crude Oil and Energy Stocks, ETF (XOP) Heading Higher
We are not expecting crude oil or energy stocks to rally in a straight line up, but we are off to a good start.
The charts...
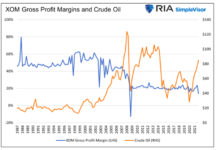
Big Oil and The Fallacy of a Windfall Profits Tax
Higher energy prices worrying you? Be afraid because Congress is coming to the rescue. Legislators are introducing a new bill called the “Big Oil...
Has the Nasdaq 100 (QQQ) Reached its Breaking Point?
The overall trend in the major stock market indices is downward.
Though we’ve had small rallies, our last jump in price was minor and right...
Q4 Earnings In Review: WSH Data Indicators versus Results
The following research was contributed to by Christine Short, VP of Research at Wall Street Horizon.
During the Q4 earnings season we profiled 12 companies...
Will High Gas Prices Usher In A Recession? (Historical Context)
While higher gas prices may be welcome news to the oil industry, the rest of us should be concerned as it is a glaring...
Will Oil’s Price Decline Offer A Lift To Stock Market?
Oil makes a reversal pattern and rejects its 80-month moving average; however, will the overall trend stay intact, or has Wednesday signified an end...
Stock Market Remains Volatile On Russia News, Inflationary Winds
The S&P 500 Index fell by 0.72% on Tuesday as the news flow was again dominated by Russia (and the U.S. banning Russian oil...
Why Oil & Gas ETF (XOP) Trading Price May Exceed $150
With Oil prices over $120 per barrel, the SPDR Oil & Gas Exploration and Production ETF (XOP) is trading sharply higher.
And it may be...
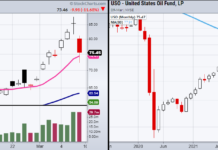
Timing Trade Entries On Fast Paced Sector ETFs
The past couple of weeks have given us a new range to watch in the stock market.
A positive jobs report has been seemingly muted...
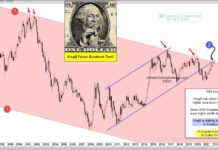
3 Times a Charm? U.S. Dollar Facing Breakout Test!
Over the past few decades, the U.S. Dollar has been weakening.
Could this weakness be coming to an end?
Today's long-term "monthly" chart highlights an important...


