The past couple of weeks have given us a new range to watch in the stock market.
A positive jobs report has been seemingly muted by indecision within the major indices.
Therefore, we can look at the new ranges the Russell 2000 (IWM) has formed along with watching the S&P 500 (SPY) to grasp a complete view of the markets’ direction on a short-term basis.
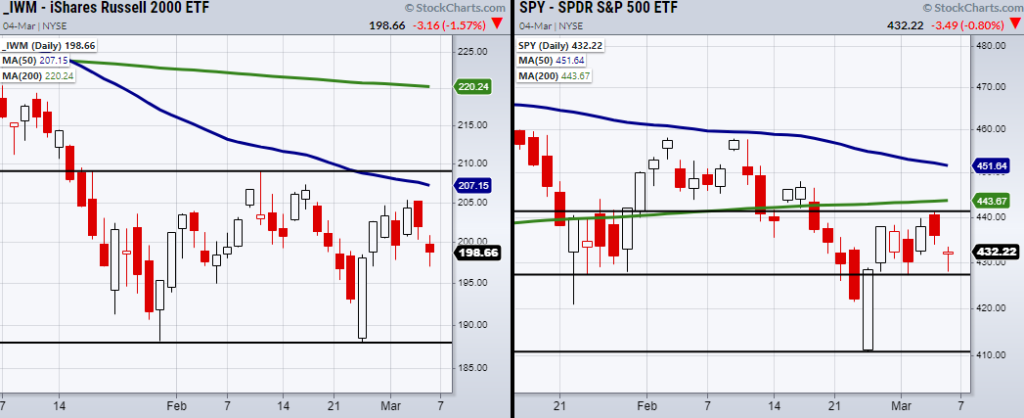
To break down our current rangebound situation, we can look at the above charts of IWM and the SPY.
IWM is currently trading in the middle of its range with a double bottom at $187.92 and the top near $209.
On the other hand, the SPY is not as easy to nail down.
Though the SPYs main low is at $410.64, it is still attempting to hold the $427 price area.
Additionally, the SPY has resistance to clear at $441.
This gives us important levels to watch for overall market direction if they clear or break.
Having said that, even with the current market environment, certain sectors including oil, precious metals, and soft commodities have made large recent moves.
For many traders, large runs can cause FOMO (Fear of missing out), however, even with their large price increases they can and probably will continue to outperform the overall market.
How to enter the top performers is the tricky part, but definitely worth the learning curve.
One way we look for an entry into a fast-moving symbol is by waiting for a small pullback where we can find consolidation before a breakout to new highs.
When using this method, it’s important to wait for the break to new highs since the pullback created a new resistance level.
For example, on Friday, Gold (GLD) broke to new highs after clearing $182.60 from 2/24.
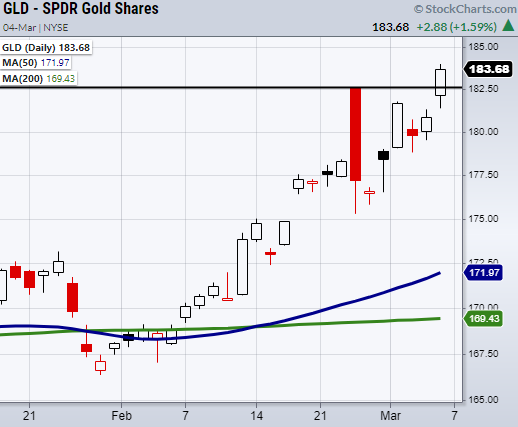
The great thing about breakouts is that if you want to play them very tight, you will always have the breakout level to tell you if you are wrong or right on the trade.
Many traders like to buy on the dip itself and risk a continued dip or locking up their capital while they wait for the symbol to clear past the recent high.
The beauty of breakout trades is having a specific level where you know if the trade is working or not.
If the symbol pulls under the breakout level, you can make a quick exit with a minor loss and patiently wait for the next breakout setup.
Though there is often chop and fakeouts in breakout trades, the idea is to keep losses small and wait for the next opportunity if the initial entry fails.
While we have specific intraday market timing techniques we teach along with a breakout, this basic setup gives a great way to enter a trade.
One last note is that if your breakout level does not hold, you should always have a predetermined price you will exit the trade if the setup fails.
This level should also be determined by the amount of money you are willing to risk on the given trade.
Watch Mish’s latest appearance on Yahoo! Finance along with some of her favorite setups on Stockcharts.com.
Stock Market ETFs Trading Analysis & Summary
S&P 500 (SPY) 441 is price resistance.
Russell 2000 (IWM) 208-209 is price resistance.
Dow Jones Industrials (DIA) 331 is price support.
Nasdaq (QQQ) 334 is price support.
KRE (Regional Banks) Watching to hold the 200-day moving average at $69.27.
SMH (Semiconductors) 246.76 is price support.
IYT (Transportation) Choppy. 261 is price area to clear.
IBB (Biotechnology) Needs to stay over 122.
XRT (Retail) 75 is price support.
Twitter: @marketminute
The author may have a position in mentioned securities at the time of publication. Any opinions expressed herein are solely those of the author and do not represent the views or opinions of any other person or entity.

: Worrisome to Broader Market?")


