The choices we make as consumers collectively shape the economic landscape.
Our spending patterns influence the well-being of our communities and the nation.
And the Retail Sector etf XRT always has a lot to say about the consumer and the markets.
- Consumer Spending and Economic Growth:
- Consumer spending constitutes approximately two-thirds of the U.S. economy. When consumers buy goods and services, it directly contributes to economic growth.
- A robust and self-sustaining recovery relies on solid growth in consumer spending.
- However, during the post-recession period, consumer spending has been growing at a modest pace compared to previous recoveries.
- Factors like gasoline prices impact consumer spending. For instance, rising oil prices lead to higher gasoline costs, reducing families’ disposable income for other purchases.
- Commodity Pricing and Consumer Spending:
- Commodity prices, especially oil prices, significantly affect consumer spending. When oil prices rise, families allocate a larger share of their budget to filling up gas tanks, leaving less money for other goods.
- This reduction in real income due to higher commodity prices can slow down the economy.
- The Pace of Recovery:
- With GDP not so great, we have had a slow, moderate pace of expansion since covid.
- Structural issues, such as housing oversupply and debt burdens, continue to impact the recovery.
- Job growth is essential for income growth, which, in turn, fuels consumer spending. The Labor market is slowing down.
- Where consumers allocate their spending:
- Housing: The largest category of consumer spending in the U.S. is housing, accounting for approximately 33.3% of total annual expenditures in 2022. This includes rent, mortgage payments, utilities, and home-related expenses.
- Transportation: Following housing, transportation represents a significant portion of consumer spending, making up 16.8% of total expenditures. This category covers expenses related to vehicles, fuel, public transportation, and maintenance.
- Food: Food expenditures account for 12.8% of total consumer spending.
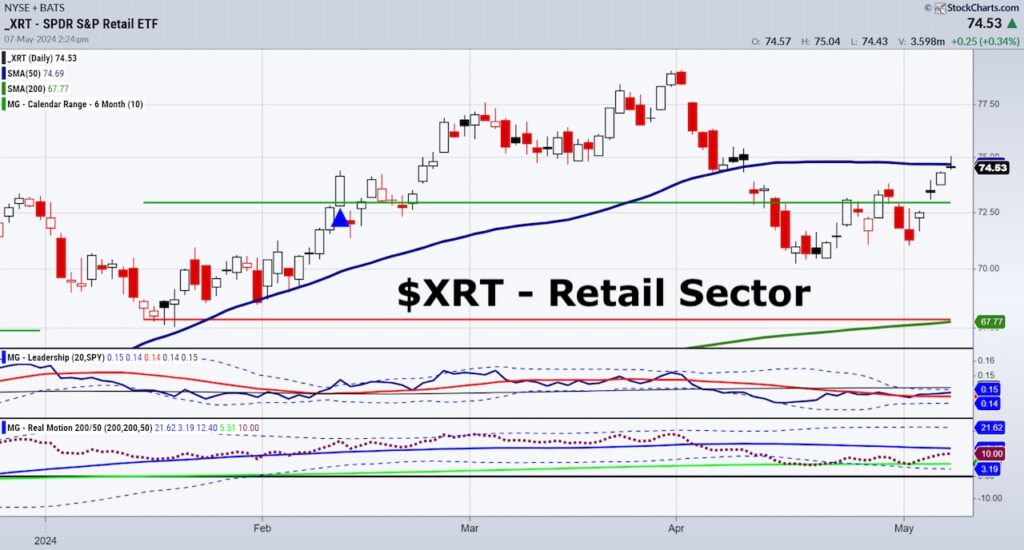
What does the chart tell us about the state of the economy and the markets?
With our comments this week on how the Transportation Sector etf (IYT) is a laggard with Retail (XRT) is doing ok.
BUT
XRT failed to hold the 50-Day Moving Average.
While XRT is above the January 6-month calendar range high, it is underperforming the benchmark.
Plus, real motion shows no divergence, so that tells us XRT can climb higher from here.
However, we must also watch for the recent rally to run its course, forcing XRT back down to test lower levels.
Most importantly, is that oil and gas levels have come off from their highs, which helps of course. But can that last?
Consumer confidence is lower than it has been.
Interest rates on housing are high, and prices are not dropping.
Plus, shelter costs have risen.
Watch XRT carefully this week.
That should tell us very quickly and reliably what the next big move in the market is.
Twitter: @marketminute
The author may have a position in mentioned securities at the time of publication. Any opinions expressed herein are solely those of the author and do not represent the views or opinions of any other person or entity.

: Showing Some Signs of Emerging Strength")

