Are Copper Futures About To Surge To Over $7
Copper prices have been running hot ever since the onset of COVID.
Sound familiar? Yep, because it's happened across several commodities.
Things are rough right now...
Stock Market Remains Volatile On Russia News, Inflationary Winds
The S&P 500 Index fell by 0.72% on Tuesday as the news flow was again dominated by Russia (and the U.S. banning Russian oil...
Why Oil & Gas ETF (XOP) Trading Price May Exceed $150
With Oil prices over $120 per barrel, the SPDR Oil & Gas Exploration and Production ETF (XOP) is trading sharply higher.
And it may be...
Timing Trade Entries On Fast Paced Sector ETFs
The past couple of weeks have given us a new range to watch in the stock market.
A positive jobs report has been seemingly muted...
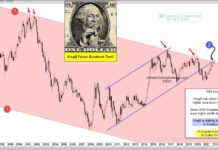
3 Times a Charm? U.S. Dollar Facing Breakout Test!
Over the past few decades, the U.S. Dollar has been weakening.
Could this weakness be coming to an end?
Today's long-term "monthly" chart highlights an important...
Gold Miners (GDX) Look Ready To Move Higher
Gold prices are pushing higher as as the war in Ukraine takes centerstage.
And as gold prices move higher, it only adds fuel to the...
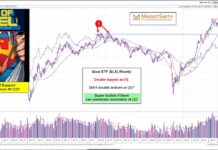
Are Steel Prices About To Explode Higher?
Geopolitical tensions surrounding the Russia/Ukraine war have sent steel prices higher.
And if the rally continues, it may mean considerably higher steel prices and added...
Stock Market Outlook Clouded By Volatility
Stock market volatility continues as prices move up and down on a daily basis creating frustration for investors.
The S&P 500 Index fell by 1.55%...
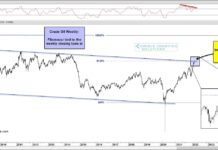
Crude Oil Prices See Volatility At 61.8% Fibonacci Resistance!
The geopolitical scene across the globe is gathering intensity as western countries and leaders clamp down on Russia for sending troops into Ukraine.
This has...
Retail Earnings Get Back on Track Following Geopolitical Sell-off
The following research was contributed to by Christine Short, VP of Research at Wall Street Horizon.
Key Takeaways:
Home Depot, Macy’s and Lowe’s all beat expectations...


