The geopolitical scene across the globe is gathering intensity as western countries and leaders clamp down on Russia for sending troops into Ukraine.
This has sparked fears about shipping and transportation of key commodities as countries impose sanctions on Russia. In turn, this is all being priced into the financial markets and adding volatility to key assets.
Today we look at crude oil and ask the question, “how much of this has been priced in?”.
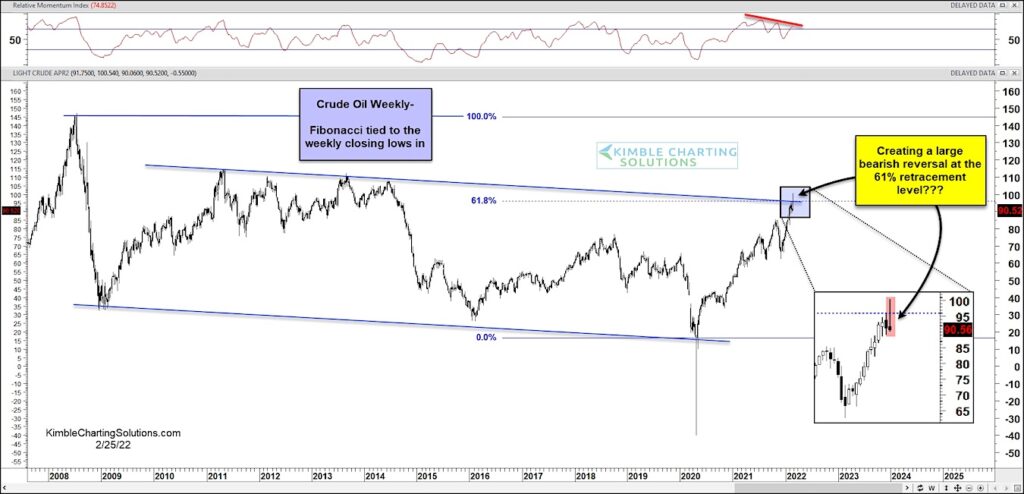
Looking at he “weekly” chart, we can see the sharp 2-year rally that has unfolded (within a declining channel) over the past 2 years. And just this week, price poked above dual resistance (formed by the upper channel and 61.8% Fibonacci of all-time closing high to 2020 closing low). BUT, as quickly as price poked through resistance near the $100 level, it reversed lower and closed back below resistance.
This price action formed a bearish reversal pattern. Note as well that momentum has been heading lower as price moved higher (bearish divergence).
Now investors will watch the top of this long “weekly” candle wick to see if the 61.8% Fib area will hold crude oil prices in check. This is clearly an important price area for oil… just as it is an important time period for the world. Stay tuned!
Crude Oil “weekly” Chart
Note that KimbleCharting is offering a 2 week Free trial to See It Market readers. Just send me an email to services@kimblechartingsolutions.com for details to get set up.
Twitter: @KimbleCharting
Any opinions expressed herein are solely those of the author, and do not in any way represent the views or opinions of any other person or entity.
: Creating Bullish Divergence?")

 and Semiconductors (SMH): Concerning Price Pattern?")
 and Semiconductors (SMH): Concerning Price Pattern?")


