Copper prices have been running hot ever since the onset of COVID.
Sound familiar? Yep, because it’s happened across several commodities.
Things are rough right now on the inflation front… but could it get worse before it gets better?
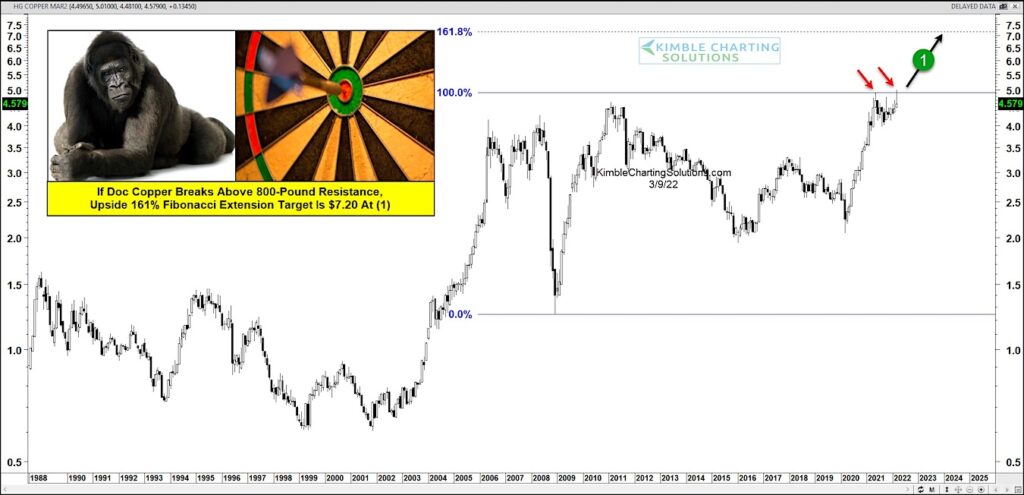
Today we look at the long-term “monthly” chart of Copper futures to highlight a major test of breakout resistance. As you can see, Copper has risen to test a key price level around $5 at (1). Should copper breakout above this level, Fibonacci analysis point to a potential move to $7.20 (the 1.618% extension level).
That would definitely not bode well for future inflation prospects. Stay tuned!
Copper Futures “monthly” Price Chart
Note that KimbleCharting is offering a 2 week Free trial to See It Market readers. Just send me an email to services@kimblechartingsolutions.com for details to get set up.
Twitter: @KimbleCharting
Any opinions expressed herein are solely those of the author, and do not in any way represent the views or opinions of any other person or entity.

 Flirting With Critical Support… Again")
