Commodities Strength Depends On U.S. Dollar’s Next Move
Inflation pressures are increasing as the economy tries to digest a prolonged period of higher commodity prices.
While select commodities have pulled back (and this...
Practical Ways to Live Through Inflationary Times
Whether we head into hyperinflation, stagflation, or recession, it is always good to be prepared for more of the same: rising commodity prices, low...
Technology Stocks Set For Long-Term Out-Performance
Today we take a look at the chart of the Nasdaq 100 ETF (QQQ) relative to the S&P 500 ETF (SPY).
As most active investors are...
Are Bank Stocks In Trouble? Watch $XLF Head & Shoulders Pattern!
Financial and bank stocks have been lagging the broad market for the past month. While the S&P 500 is posting new all-time highs, the...
What To Make Of U.S Stock Market’s Mixed Signals
The safest place in Tuesday’s trading session was the tech sector.
The tech-heavy Nasdaq 100 (QQQ) closed a pinch up on the day, while the...
Q3 Investor Update: Equities Pullback Paranoia Persists
Looking back six months ago, we noted in our report that the setup for 2021 appeared ‘challenging’.
Well, ‘challenging’ it was not.
With the severity of the...
Stocks and ETFs To Buy Amidst Rising Consumer Prices
Input prices continue to rise and are being passed on to consumers. And it is likely broad based.
General Mills recently stated they would have...
Can Dow Jones Industrial Average Close Gap With Nasdaq?
The Dow Jones Industrial Average (DJIA) is trying hard to close the gap with the S&P 500 Index and Nasdaq 100 Index.
The Dow Jones...
New Zealand Dollar Approaching Bullish Elliott Wave Support
In this article, I look at New Zealand dollar which is in the process of making what appears to be a bullish retracement /...
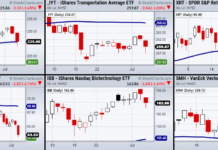
$IYT Transportation Stocks Bearish Within Broader Bullish Trend
The recovery for hard hit stock market sectors like transportation stocks has been pretty amazing. Sometimes it even feels surreal.
After the onset and awareness...


