The recovery for hard hit stock market sectors like transportation stocks has been pretty amazing. Sometimes it even feels surreal.
After the onset and awareness of COVID-19 and government health protocols and lockdowns, it seemed that anything related to transportation would have a long road to recovery.
The Transportation Sector ETF (IYT) cratered by over 40 percent in a month and most bulls at the time would have been thrilled with 100 percent returns over the next 2-3 years. It took just 6 months to get back to even… and 6 months after that $IYT was nearly 40 percent above its price when the COVID crash began.
Okay, so that’s clearly bullish price action. But the Transportation Sector ETF (IYT) has taken a breather of late and it’s time for an update. See charts below.
Note that the following MarketSmith charts are built with Investors Business Daily’s product suite.
I am an Investors Business Daily (IBD) partner and promote the use of their products. The entire platform offers a good mix of technical and fundamental data and education.
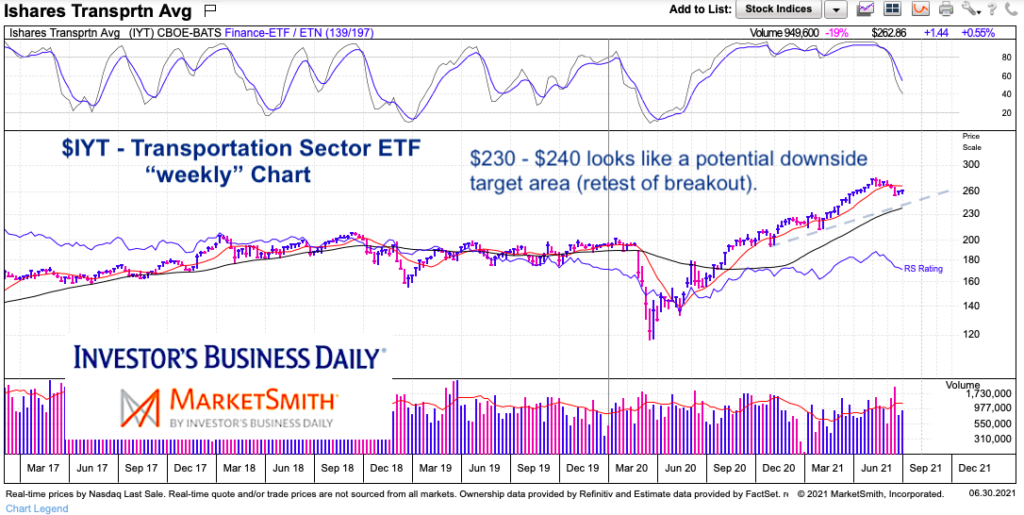
$IYT Transportation Sector ETF “weekly” Chart
First, we look at the “weekly” chart for a broader view of the trends and key indicators. We can see that price has pulled back and relative strength and momentum have tailed off. The first warning was the move below the 10-week moving average. That neutralized the situation.
Broad support lies at the rising 40-week moving average (which also coincides with a multi-week trend line). Support lies around $230-$240.
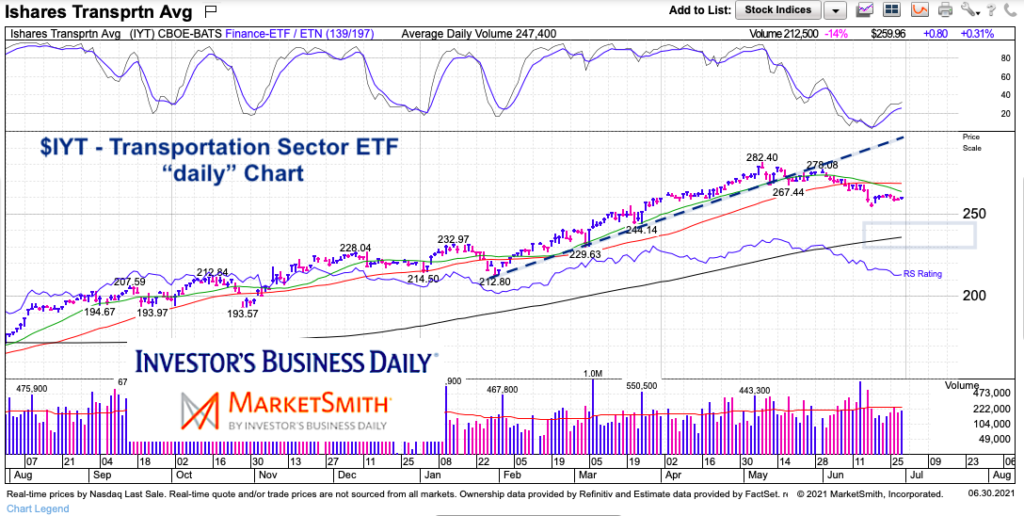
$IYT Transportation Sector ETF “daily” Chart
Zooming in on the “daily” chart, we can see that the near-term trend was lost as the 20-day moving average turned lower… and confirmed when price breached the 50-day moving average. Potential price targets lie below near the 200-day moving average, which also coincides with the $235 area.
Price is attempting to consolidate (as is momentum), while relative strength remains weak. Falling 20 and 50 day MAs likely mean a failed rally and one more move lower. The best case for bulls is more sideways action to work off oversold metrics, followed by a rally that curls the short-term MAs higher. We’ll see.
Twitter: @andrewnyquist
The author may have a position in mentioned securities at the time of publication. Any opinions expressed herein are solely those of the author, and do not in any way represent the views or opinions of any other person or entity.

: Showing Some Signs of Emerging Strength")
