Financial and bank stocks have been lagging the broad market for the past month. While the S&P 500 is posting new all-time highs, the SPDR Financial Sector ETF (XLF) is trading below its highs.
So what’s the big deal? As you likely know, the Financial sector is a a big part of the economy and stock market… so bulls would prefer to see healthy financial and bank stocks.
On one hand, the price action can be called a bullish consolidation as buyers take a breather and allow over-heated prices cool off. On the other hand, the price action has taken the shape of a head and shoulders topping pattern and may be warning of further downside.
Okay, so let’s turn our attention to today’s featured chart. As you can see, the Financial Sector ETF (XLF) has been lagging and is mired in a downtrend over the past month.
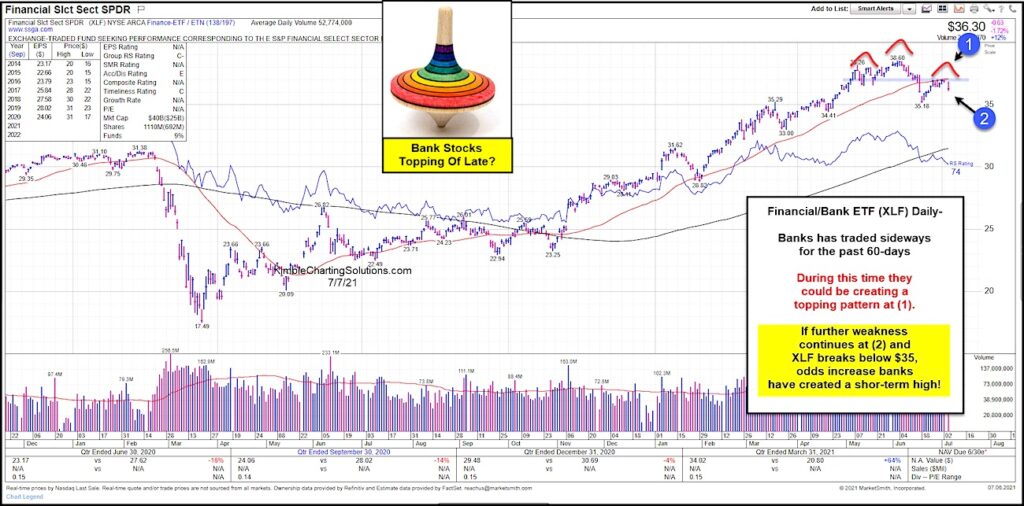
During this time, XLF could be creating the right shoulder of a bearish head and shoulders pattern at (1). This pattern is also taking shape below the 50-day moving average.
If further weakness ensues at (2) and price breaks below $35, the odds increase that financials / banks have put in a near-term high!
Will buyers show up here? Or will bears continue to pressure XLF lower? Stay tuned!
$XLF Financials Sector ETF “daily” Chart
Note that KimbleCharting is offering a 2 week Free trial to See It Market readers. Just send me an email to services@kimblechartingsolutions.com for details to get set up.
Twitter: @KimbleCharting
Any opinions expressed herein are solely those of the author, and do not in any way represent the views or opinions of any other person or entity.


 Rolling Over At Key Fibonacci Level?")

