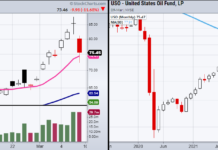
Will Oil’s Price Decline Offer A Lift To Stock Market?
Oil makes a reversal pattern and rejects its 80-month moving average; however, will the overall trend stay intact, or has Wednesday signified an end...
Are Copper Futures About To Surge To Over $7
Copper prices have been running hot ever since the onset of COVID.
Sound familiar? Yep, because it's happened across several commodities.
Things are rough right now...
Could Peak Oil Be Happening Right Now?
Crude oil prices (and everything else) started rising with COVID and supply chain issues. And now that we are adding sanctions on Russia and...
Is S&P 500 Bullish Divergence Signaling A Bottom For Stocks?
The US equity markets essentially topped out in November of last year. While the S&P 500 index actually made a higher high in January 2022,...
Stock Market Remains Volatile On Russia News, Inflationary Winds
The S&P 500 Index fell by 0.72% on Tuesday as the news flow was again dominated by Russia (and the U.S. banning Russian oil...
Can Transportation and Retail Sector ETFs Hold Critical Support?
After oil surges in volume from the U.S import ban on Russian oil, the oil ETF (USO) closed roughly unchanged from its opening price...
Russell 2000 Defending Price Support For Big Boys
As the stock market continues to sputter, there are some inklings that it may be trying to bottom.
Divergences are emerging and a few sectors...
Why Oil & Gas ETF (XOP) Trading Price May Exceed $150
With Oil prices over $120 per barrel, the SPDR Oil & Gas Exploration and Production ETF (XOP) is trading sharply higher.
And it may be...
Are U.S Treasury Bonds (TLT) a Lagging Safety Play?
The U.S stock market continues to display pressure from the Russian—Ukraine war.
Additionally, High Yield Corporate Debt (JNK) broke support from its recent lows at...
S&P 500 Bearish Triangle May Lead To Additional 8% Decline!
The financial markets remain volatile as inflation, supply chain issues, and serious geopolitical events cloud the immediate future.
This volatility has manifested itself into a...


