The financial markets remain volatile as inflation, supply chain issues, and serious geopolitical events cloud the immediate future.
This volatility has manifested itself into a bearish descending triangle on the broad U.S. stock market index the S&P 500.
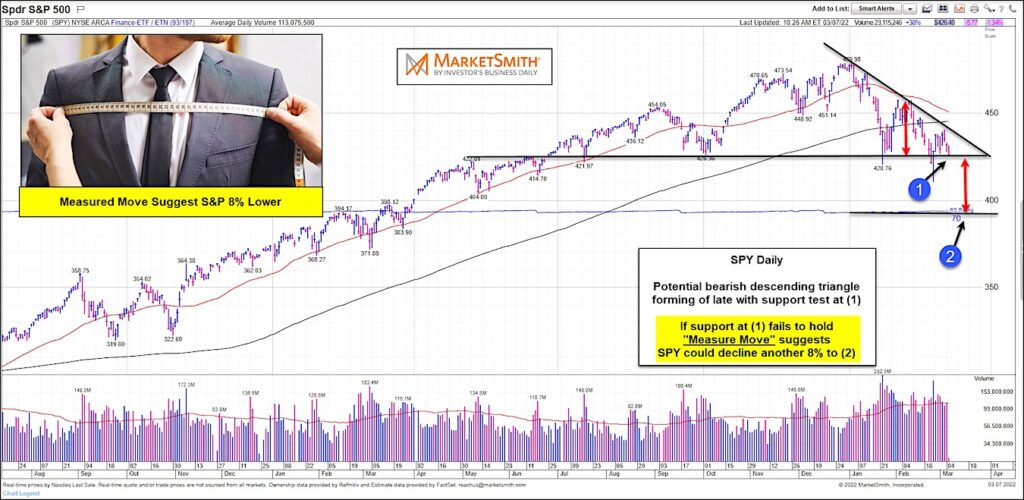
Looking at the chart below (of the S&P 500 ETF $SPY), we can see this triangle formation. Note the height of the last rally via the upper red arrows, as well as the major price support area at line (1).
Is the stock market selloff over?
Well, this support line may very well be our tell. If support at (1) fails to hold, a “measured move” suggests that the S&P 500 ETF could fall another 8 percent to (2).
A move like this would further rattle the financial markets and perhaps your portfolio. Stay tuned!
S&P 500 Index Chart
Note that KimbleCharting is offering a 2 week Free trial to See It Market readers. Just send me an email to services@kimblechartingsolutions.com for details to get set up.
Twitter: @KimbleCharting
Any opinions expressed herein are solely those of the author, and do not in any way represent the views or opinions of any other person or entity.


")

 Ready To Break Out?")
