As the stock market continues to sputter, there are some inklings that it may be trying to bottom.
Divergences are emerging and a few sectors are trying to hold up better than the broader market.
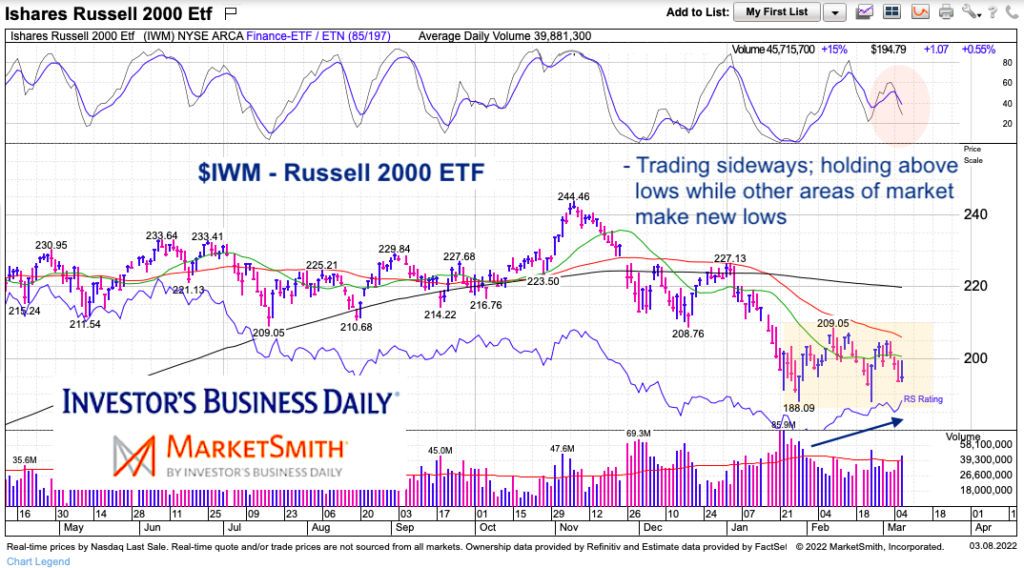
In today’s case, we take a look at the small cap Russell 2000 ETF (IWM) which ended positive today despite the markets drubbing. It is currently trading well off its lows. That’s the good news.
But it won’t be easy for the small caps to keep a positive signal in this storm (and hold up the larger caps). Trend and momentum are heading lower, so it will take a fight. But it’s something to at least keep on your radar.
Note that the following MarketSmith charts are built with Investors Business Daily’s product suite.
I am an Investors Business Daily (IBD) partner and promote the use of their products. The entire platform offers a good mix of analysts, education, and technical and fundamental data.
$IWM Russell 2000 ETF Chart
As you can see, the small cap index was crushed with the initial selloff, falling over 20 percent. But those lows have held in sideways trading with relative strength perking up. But this battle begins in earnest at the falling 50-day moving average around $206. That’s still a nice 5 percent rally from here and quite do-able over near-term if market holds up. But that will pause strong resistance and likely require 2-3 closes above to imply a move to the 200-day moving average is possible.
Twitter: @andrewnyquist
The author has a trading position in mentioned securities or similar at the time of publication. Any opinions expressed herein are solely those of the author, and do not in any way represent the views or opinions of any other person or entity.
: Creating Bullish Divergence?")


 and Semiconductors (SMH): Concerning Price Pattern?")


