It’s time for another set of 5 macro technical charts to watch as we move further into the month of January (including stock market indices, sectors, individual commodities, currencies, bonds, and other benchmarks and market indicators).
This chart review will look at technical price developments. And even if you’re not technical analysis minded I believe that it’s a useful way to keep on top of global market trends across the main financial markets. You can also use this chart analysis as a prompt for further analysis and investigation…
Today we look at charts of Copper Futures, the British Pound (GBP/USD), the Euro Stoxx 50, Coffee Futures and its ETF (NYSEARCA:JO), and the South Korea ETF (NYSEARCA:EWY).
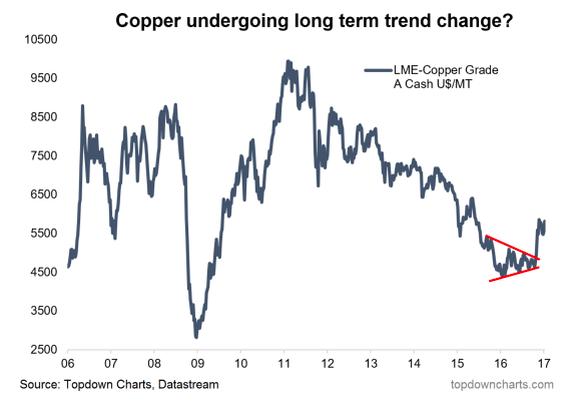
1. Copper – Bull flag
After an upside breakout from a symmetrical triangle, as previously flagged copper is now undergoing another critical point. The latest pattern to form is a bullish flag formation, typically this is a continuation pattern and using the measure rule of the flag being crica half way up the “pole” upside would be as much as 20%.
The other implication of an upside breakout from the bull flag would be a more clear upside breakout of the down trend of the past 5 years; it would also place the price around the previous support levels around 6800-7000. Overall technical view: Bullish bias, trigger is an upside break of the bull flag.
Next chart (British Pound – GBPUSD)…


 Nears Important Pivot Point")

