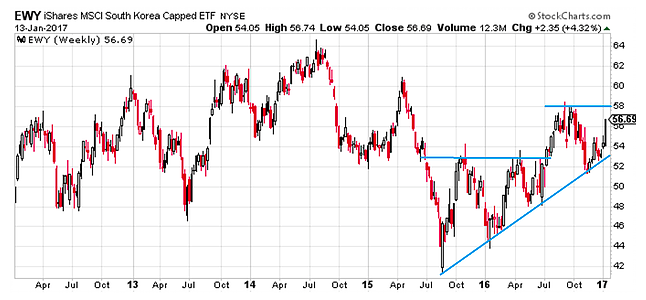
5. Korea – Ascending the triangles
South Korea ETF (NYSEARCA:EWY) saw an upside breakout of a large ascending triangle on the weekly chart in 2016.
Subsequently the breakout failed and what appears to be yet another ascending triangle is forming.
We’re left with 2 key trend lines: 1. Resistance of 58, and 2. Support of the upward sloping trend line in place from mid 2015. With the 50 and 200 day moving averages showing bullish trend signals, a bullish bias is warranted.
Overall technical view: Bullish, 58 is the long side trigger, 54 the short side.
Thanks for reading.
Twitter: @Callum_Thomas
Any opinions expressed herein are solely those of the author, and do not in any way represent the views or opinions of any other person or entity.


 Ready To Break Out?")
")