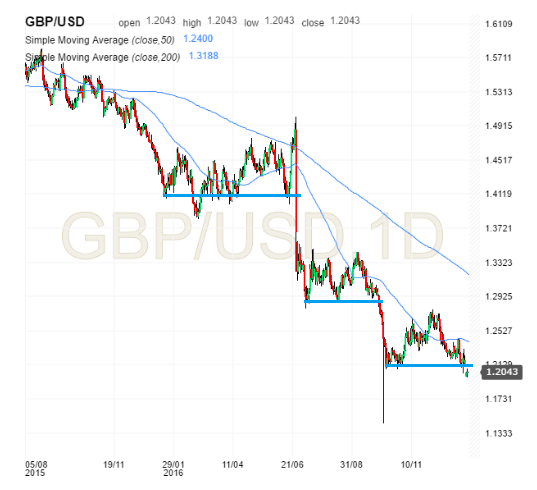
2. GBPUSD – Brexitdown, er, I mean Breakdown
GBPUSD broke down through support of 1.21. Previously breaks of support have been followed by significant moves e.g. 1.41 and 1.29 (with the exception of the false breakdown through 1.41 in February 2016).
At present the daily RSI is not yet oversold so it’s too soon to call a bottom, but as pointed out previously speculative futures positioning has been stretched to the short side for some time. Overall technical view: Bearish bias, bears watch for any signs of a false breakout or oversold conditions.
Next chart (Euro Stoxx 50 Index)…


