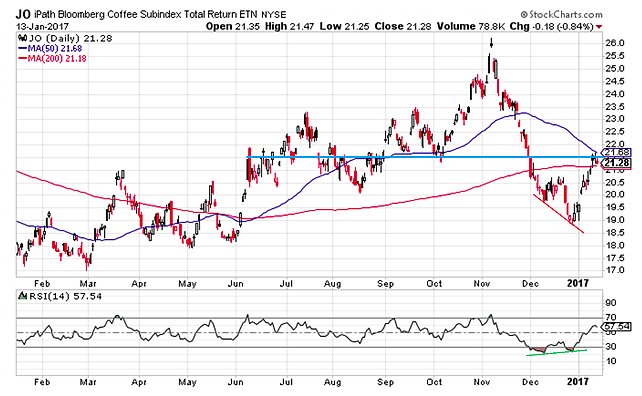
4. Coffee – Bottom is in, now what?
Bullish divergence (lower low on price vs higher low on RSI) concluded with a bottom in the coffee ETF. Aside from a breakaway gap price has broken up through the 200 day moving average.
But coffee now faces two key tests; can it break up through the 50 day moving average? and can it break through resistance of 21.5? Overall technical view: Bullish bias but the key trigger is a solid break of the 50dma AND support of 21.5
Next chart (South Korea ETF)…


 Flirting With Critical Support… Again")