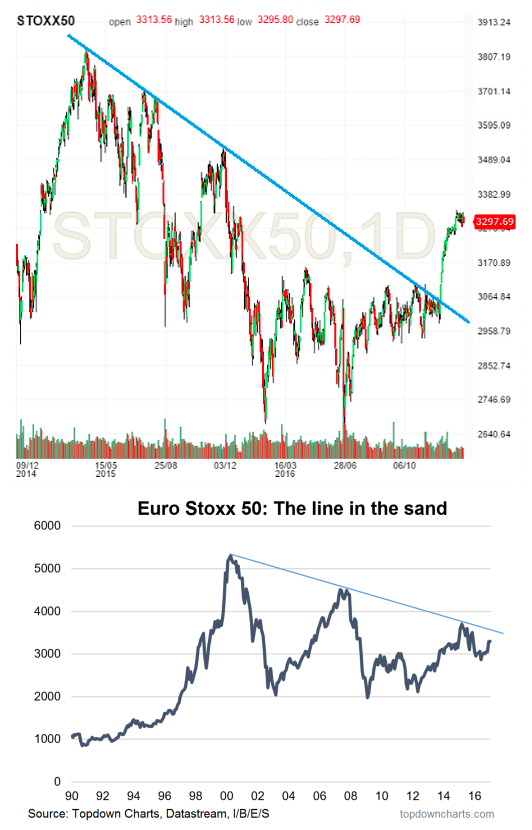
3. Euro Stoxx – One test passed…
Euro Stoxx 50 has passed one test in making a fairly convincing breakout from the down trend line established from the peak in 2015. The next test comes by looking at the monthly chart which shows an even longer term down trend line established from 2000 and tested 3 times; one would be right to ask will this time be different?
The 50 and 200 day moving averages are putting in strong up-trend signals, but 3300 is an important level. Overall technical view: Bullish bias, caution should be applied as the long term trend line is approached, but an upside breakout of the longer term trend line will be very bullish medium-term.
Next chart (Coffee ETF – $JO)…


