February WASDE Report Summary For Corn and Soybeans:
On Tuesday the USDA released its February 2016 World Agricultural Supply and Demand Estimates (the February WASDE report). There were very few surprises in the report but it did weigh a bit on corn prices (futures).
In corn the USDA increased the U.S. 2015/16 corn carryout to 1,837 million bushels, 35 million bushels above the January estimate and 28 million better than the average trade guess of 1,809. This is the largest U.S. corn ending stocks figure since 2005/06 (1,967 million bushels).
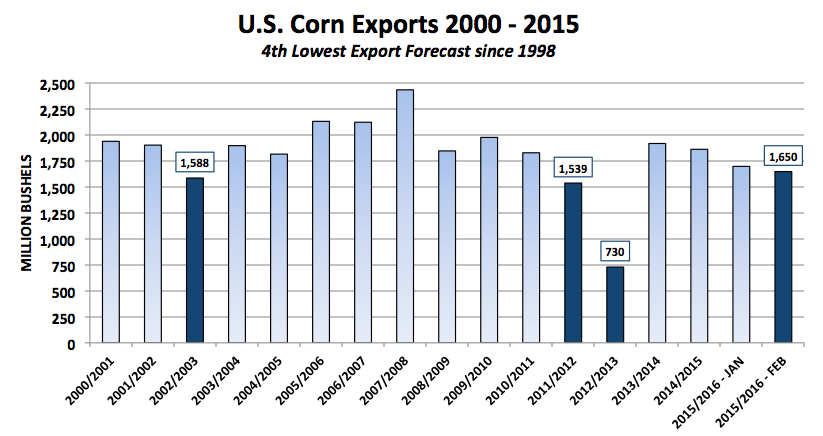
The most notable demand adjustment in the February WASDE report was yet another reduction to U.S. corn exports, which were lowered 50 million bushels month-on-month to 1,650 million. That represents the 4th lowest U.S. corn export projection since 1998. U.S. corn-ethanol use was raised 25 million bushels to 5,225 million; however that increase could prove short-lived with industry ethanol margins still hovering just below breakeven, as well as, U.S. ethanol inventories soaring to a new all-time high of 22.956 million barrels as of the week ending 2/5/2016 (versus the previous record high of 22.713 million barrels on 3/16/2012). This should pressure U.S. ethanol values in the weeks ahead, adding additional stress to spot ethanol margins. See my thoughts and forecast on Corn prices further below.
Further Reading From Marcus: “The Iowa Caucuses & The Renewable Fuel Standard: Where Candidates Stand“
The World corn estimates also offered few, if any, bullish sub-plots. Both Argentina and Brazil’s 2015/16 corn production forecasts were raised in the February Crop report a combined 3.9 MMT (154 million bushels). As a result Argentina’s corn export projection was increased to 17 MMT (up 1 MMT versus January) with Brazilian corn exports revised upward to 28 MMT (up 2.5 MMT versus January). The only notable increase in imports came in South Africa (up 1.5 MMT versus January), however that business is likely to flow to either Argentina or Brazil, which both hold a distinct freight spread advantage to South Africa versus the United States. 2015/16 World corn stocks were essentially unchanged at 208.81 MMT versus the average trade guess of 208.25 MMT. Ultimately there was nothing even remotely momentum changing in the report fundamentally speaking for Corn Bulls, which certainly added to the sideways to lower action in corn prices this week.
Now let’s look at what the February WASDE Report said about soybeans… In soybeans the USDA made only minor adjustments to the U.S. balance sheet. 2015/16 U.S. soybean ending stocks improved 10 million bushels month-on-month to 450 million bushels versus the average trade guess of 445 million. This is the largest U.S. soybean carryout figure since 2006/07 (574 million bushels).
The soybean crush was lowered 10 million bushels to 1,880 million with exports unchanged versus January at 1,690 million; however that’s down more than 8% or 153 million bushels from a year ago.
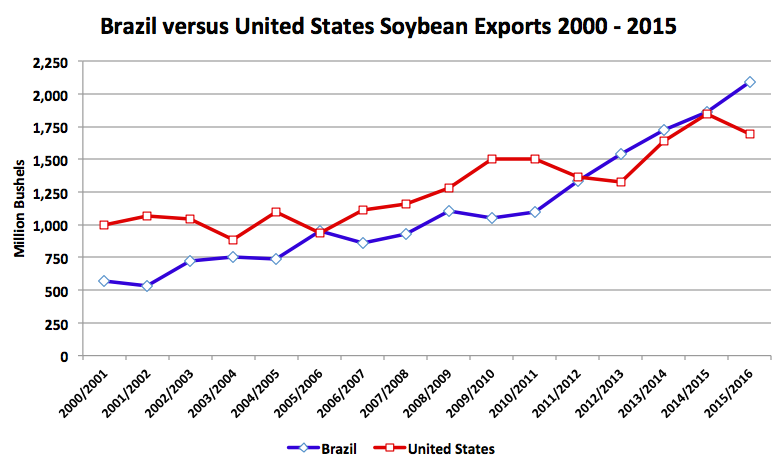
U.S. soybean exporters continue to face stiff competition from Brazil with Brazilian soybean exports projected to be record large at 57 MMT, which is 11 MMT or 400 million bushels more than the United States. 2015/16 World soybean stocks improved slightly in February, increasing 1.14 MMT to 80.42 MMT versus the average trade guess of 78.97 MMT. Overall, the U.S. and World soybean S&D tables remain largely no different than corn relative to their pervading market impact. Surplus ending stocks, slumping export demand, and no production concerns in South America continue to weigh heavily on prices.
Current Considerations For Corn Prices: March corn futures ended Friday’s session at $3.58 ¾, closing down 7-cents per bushel week-on-week. I mentioned in last weekend’s column the importance of March corn futures holding the 35-day moving average early Monday morning. That did not happen with CH6 closing below that key support level. Immediate selling pressure ensued with the latest Commitment of Traders report showing the Managed Money net short in corn ballooning back up to -102,785 contracts. Money managers were weekly sellers of over 43k corn contracts (as of the market close on 2/9/2016).
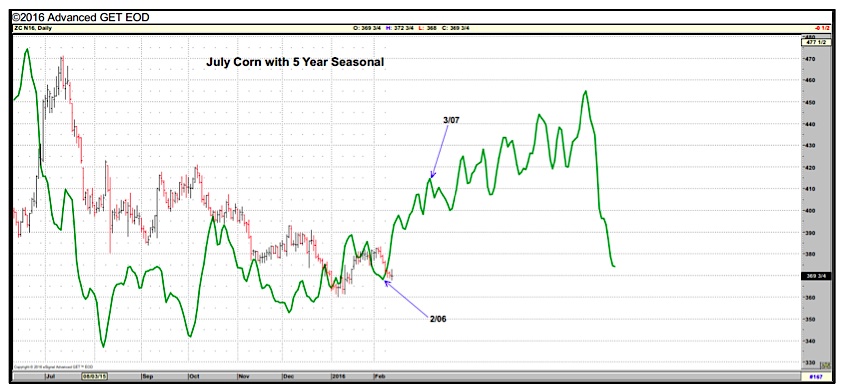
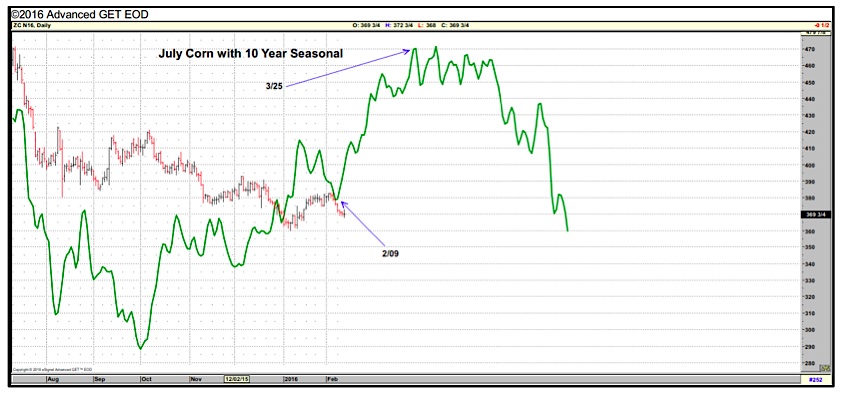
Will this recent downtrend in corn prices continue? Both the 5 and 10-year price seasonals in July corn futures (CN6) show corn prices rallying into and through the end of March. However I think it’s important to point out that this was not the case during last-half February through first-half March of 2015, which largely featured sideways to lower corn prices. Why is that significant? In February and March of 2015 U.S. corn ending stocks were forecasted at an average of approximately 1,800 million bushels, not dissimilar to the USDA’s latest February estimate of 1,837 million. Therefore the 5 and 10-year seasonal uptrends weren’t analogous to the specific price action a year ago, which again coincided at that time with a U.S. corn carryout trading at a 9-year high. I believe that scenario to be much more in-line with the current 2015/16 U.S. corn supply and demand makeup.
5 & 10 Year Seasonality For Corn Prices
continue reading on the next page…


")
