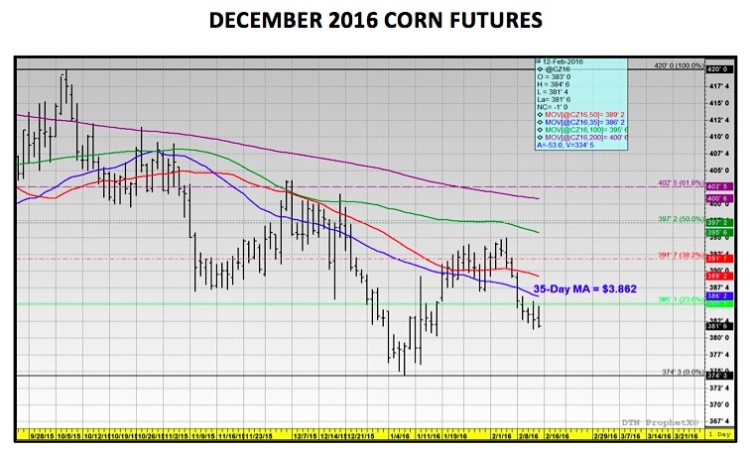
Therefore what should corn traders anticipate as far as short-term action in corn prices is concerned (defined as the next 45-days)?
Winter corn rallies (January-March) are historically associated with 3 different price drivers none of which are in play this year. They are, in no particular order: Strong U.S. corn export demand, low carryin stock estimates for 2016/17, and/or the belief that U.S. corn planted acreage will contract in the March 31st Prospective Plantings report.
I previously mentioned that U.S. corn exports are currently projected at their 4th lowest total since 1998. Meanwhile, 2016/17 U.S. corn carryin stocks could be the highest they have been in 9 or 10-years, providing a huge cushion to 2016 U.S. corn production prospects.
And finally, a number of notable private analysts are still projecting a U.S. corn planted acreage increase this spring despite new-crop corn futures (CZ6) still trading well below $4.00 per bushel. Therefore I fully expect corn prices (futures) to continue trading in a relative narrow, 25 to 30-cent per bushel range into last half March.
Is there any good news for Corn Bulls?
I still believe strongly rallies will materialize; it’s just going to take longer due to the obstacles I just outlined. The reality is the U.S. is coming off to 2 record growing seasons. Looking back on historical precedent alone, scoring the trifecta would essentially be unheard of. However weather related volatility takes time to establish. Last year the market never really found a pulse until early July. I would expect a similar wait this year (May through July). That said I do believe there are opportunities right now to start pre-positioning for a move this spring and/or summer. Getting long option volatility in the low 20% range has value.
Thanks for reading.
Twitter: @MarcusLudtke
Author hedges corn futures and may have a position at the time of publication. Any opinions expressed herein are solely those of the author, and do not in any way represent the views or opinions of any other person or entity.
Data References:
- USDA United States Department of Ag
- EIA Energy Information Association
- NASS National Agricultural Statistics Service


