We’ve been following the Russell 2000 Index closely over the past year. In March, we showed how the iShares Russell 2000 ETF (IWM) was testing an area of non-traditional resistance on a monthly time frame. Since then, price has fallen away from that area, and we now see better confirmation of the developing bearish market pattern.
In this post, we show some initial lower price targets for the Russell 2000 ETF (IWM), as well as areas to watch for potential trade entries.
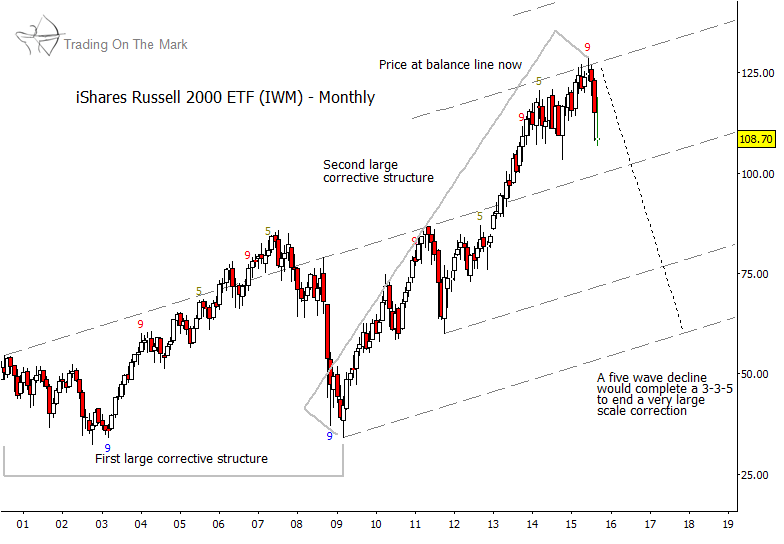
Russell 2000 ETF Puts Strain On Bullish Geometry
Let’s start with a monthly chart. The chart below shows how IWM has pulled away from the resistance we noted earlier, as represented by the balance lines in Barrie Hetirachi’s Five Point Pattern tool in Wave 59, the charting package we use. Even if the market reverses as we expect, those lines may continue to provide support and resistance during future years.
A weekly chart of the Russell 2000 ETF provides more detail about the potential reversal (see below). Throughout the rally from 2011 to 2015, IWM obeyed a channel structure fairly well. Price extremes usually met with support or resistance at either the main channel lines or their harmonics. In particular, the wave we labeled as [iv] found support at the Schiff channel boundary, which is common for fourth waves.
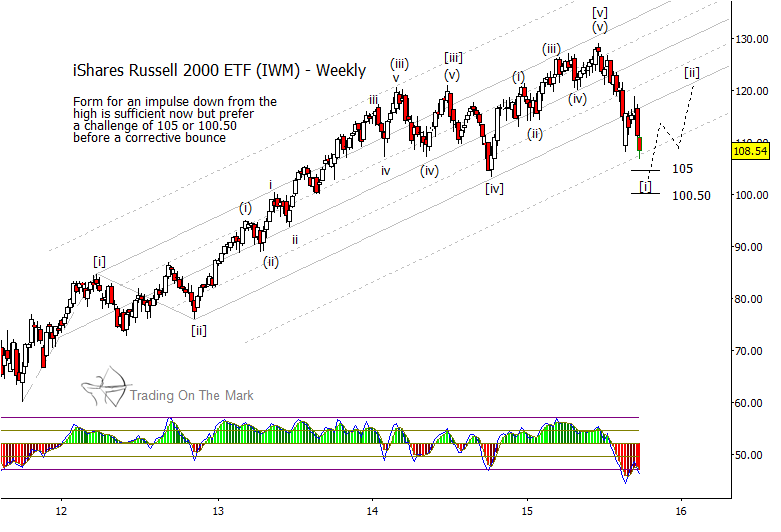
In recent weeks, IWM has departed from the main area of the channel and headed lower. The initial retest of the lower channel boundary (solid line) from below was rejected. Although not definitive, this is a classic sign of market reversal.
Going forward, we expect the structure of downward wave [i] to be composed of five sub-waves. The minimum criteria for that structure were met this week with a modestly lower low near the channel’s 50% harmonic. However, we believe price should push lower before wave [i] reaches exhaustion and the Russell 2000 begins a bounce. The most probable price target areas are near 105 and 100.50.
Readers here know that rallies in a bear market can be swift and unforgiving, so we suggest treating bearish trades with caution. A Santa rally is a probable outcome once a flush out move lower is completed. One of the best areas to watch for future resistance will be a retest of the broken channel line, which might occur late this year or early in 2016. That scenario would place a lower high as wave [ii] in the vicinity of 120, and we should be able to refine the target better after downward wave [i] is complete.
The German DAX has showed similar developments this summer with regard to broken channel geometry. And we recently wrote about why the German DAX bear market may continue into 2016. We will provide an update in our next article to be posted here on See It Market over the weekend. So far, the bearish move in the DAX has been relatively larger than what we see with IWM, which may serve as a clue about the strength of forthcoming declines in IWM and in U.S. equity indices.
We’d like to keep you on top of the trades! Get timely market updates by visiting our site and following Trading On The Mark on Twitter and Facebook.
Twitter: @TradingOnMark
No position in any of the mentioned securities at the time of publication. Any opinions expressed herein are solely those of the author, and do not in any way represent the views or opinions of any other person or entity.


 Ready To Break Out?")
")
 Rolling Over At Key Fibonacci Level?")
