On the stock exchanges in the United States and globally, many of the equity indices we monitor are displaying potential topping patterns and signals. Some have reached significant upward targets and resistance levels. Others appear ready to create lower highs this month. Among the U.S stock market indices, the Russell 2000 (RUT) offers one of the clearest examples of an index that may be on the verge of a major reversal. Here we present some of the technical evidence for a top developing in the iShares Russell 2000 ETF (IWM).
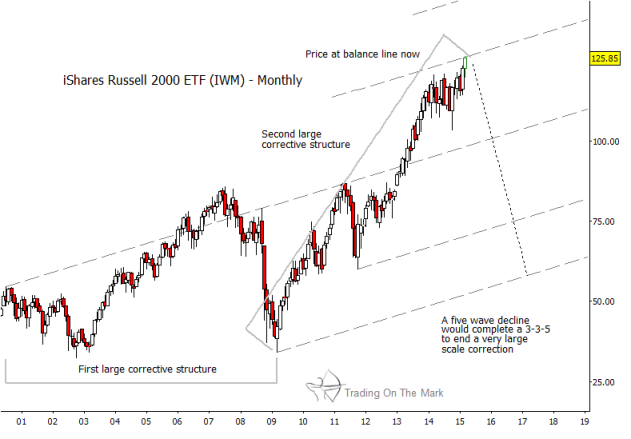
The monthly chart below shows how IWM has moved up to test the resistance we have been watching for more than a year. The balance lines on the chart form an unorthodox type of channel based on the “Five-Point Pattern” tool that was developed by Barry Heiterachi. Guided by a larger Elliott wave count, we have anchored the tool at the most significant highs and lows during the last 15 years, and the resulting balance lines show some of the most likely areas for resistance.
The monthly chart also shows the entirety of the move up from the 2009 low – a move which we view as a three-wave corrective structure. The price action prior to 2009 also appears corrective, and the implication of two corrective structures in a series is that they should be followed by a strong five-wave reversal move of similar magnitude. The dotted line drawn on the chart shows an approximate path going forward for the Russell 2000 ETF.
Russell 2000 ETF (IWM) – Monthly Chart
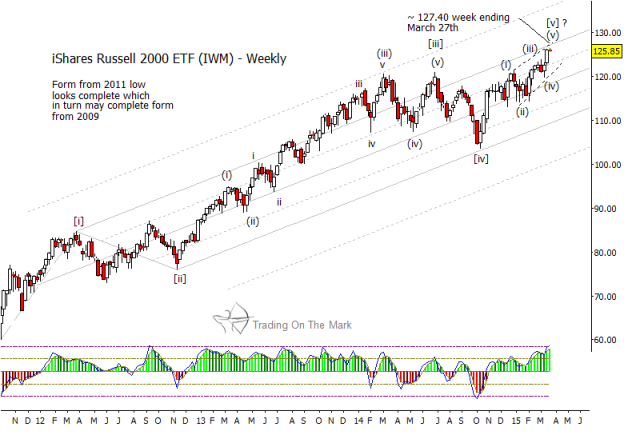
If the move up from 2009 was corrective in Elliott wave terms, as we assert, then the final of the three legs should consist of five sub-waves. The weekly chart below shows how IWM has produced a nearly complete count of five waves up from the 2011 low.
Note in particular how price tested the lower edge of the channel last autumn before rebounding. That recognition of the boundary is a hallmark of fourth waves, and it lends credibility to this particular way of counting the advance. The pattern following wave [iv] should be a terminal move, and it appears to be on the verge of completion as an ending-diagonal structure.
Russell 2000 ETF (IWM) – Weekly Chart
This is an important time for the markets, and we will do our best to keep readers up-to-date. A companion post on our website presents a daily chart for IWM, showing a closer view of the count and nearby targets.
Our next eBook will present charts and analysis for this and six other major U.S. equity indices as well as treasury bonds. It will be available in early April through our website and at Amazon. Keep an eye out for it.
Thanks for reading.
Follow Tom & Kurt on Twitter: @TradingOnMark
No position in any of the mentioned securities at the time of publication. Any opinions expressed herein are solely those of the author, and do not in any way represent the views or opinions of any other person or entity.


