 Yesterday’s near global stock sell off pulled some equity indices back into resistance zones early March seemed to extricate them from, while others saw definite breaks that are ominously bearish if they press on from here. Here’s a glance (15 of them) at selected indices at major technical way points, making major moves or looking poised to do so.
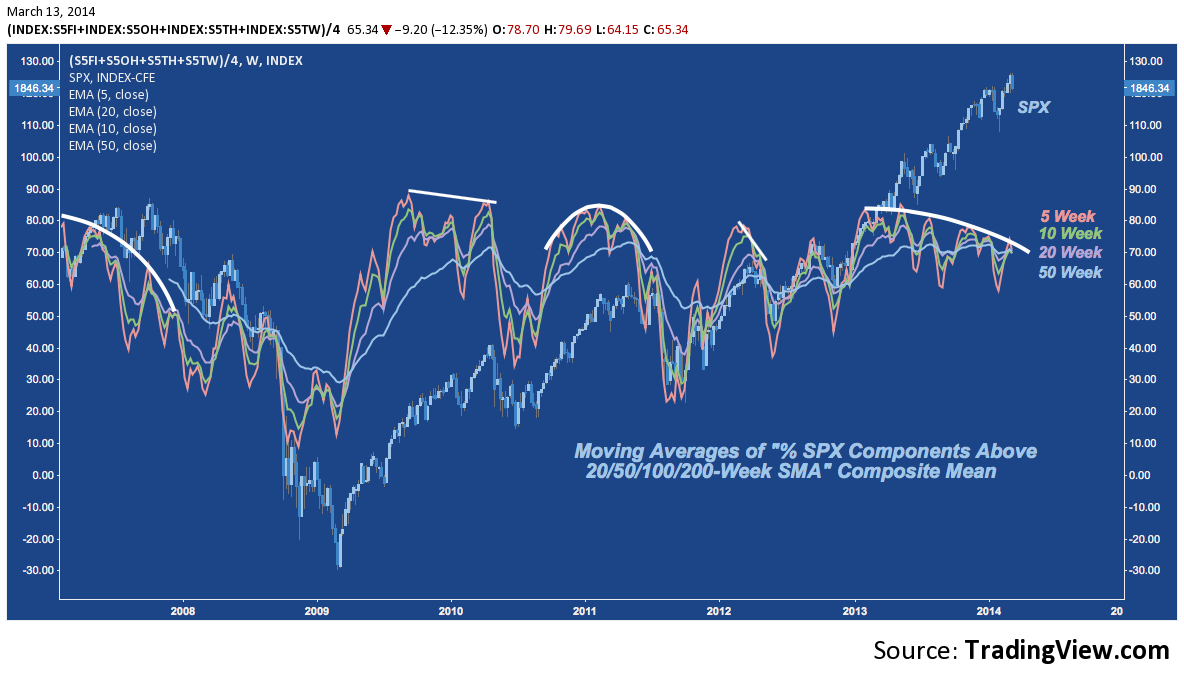
S&P 500 (SPX) – Weekly: Composite Participation Continues to Roll
Participation in the S&P’s continued rally continues to slowly wither as measured by the percentage of components that trades above key moving averages. Below we’ve derived the average of “% SPX components trading above 20/50/100/200-week SMAs” and then further smoothed that series with 5, 10, 20 and 50 week EMAs for a composite view of participation. 2013’s persistent trend with quickly eliminated pullback created a lengthy of oscillations in these EMAs; but while the market soared, even the most responsive/volatile of these EMAs (5-week) entered a lower high every time.
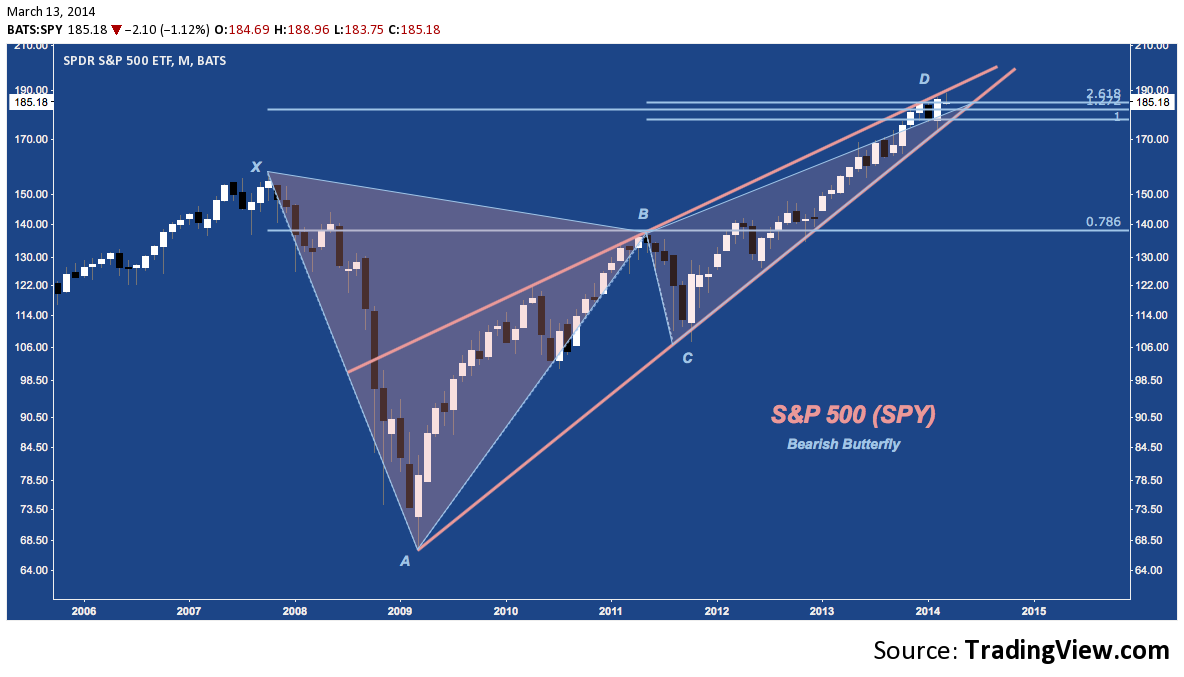
S&P 500 (SPX) – Monthly: Bearish Butterfly
The S&P enters March with 4 months of broad consolidation behind it, struggling to push through it’s Bearish Butterfly potential reversal zone (PRZ) at point D. After February’s determined rally closed the index at new all-time highs, March seemed poised to continue; but with rising wedge resistance tagged, SPX has sold off back into last month’s range, creating a harami star at multi-year structured resistance. Mounting a breakout from this PRZ above the rising wedge isn’t a scenario to ignore; but it won’t happen this year without the S&P establishing an acute upward trajectory like mid-2009, late 2010 and Oct-Feb 2012.
The Butterfly here suggests a decline of 20-25% (targeting B). For this to happen, SPX must cut back through the PRZ (negating February’s gains) and breaking through wedge support: both developments which would give the market a solid baseline of bearish cred before ranging lower. The major impediment to reaching B is the 2007 high at X.
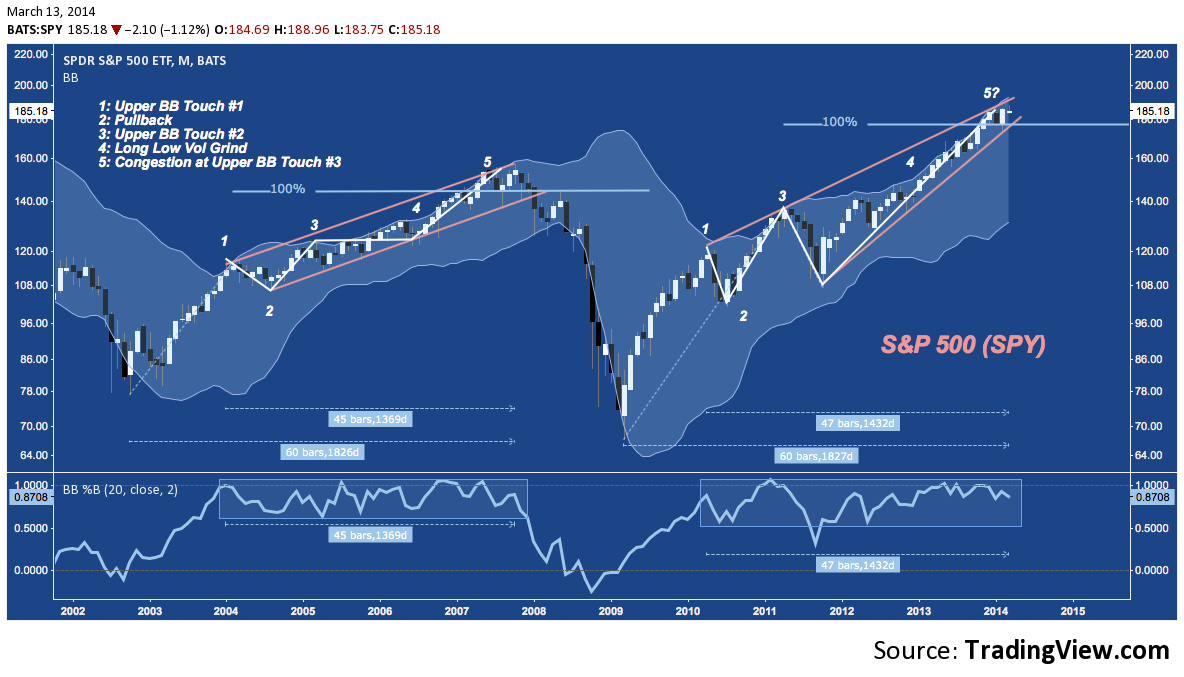
S&P 500 (SPY) – Monthly: 2002-2007, 2009-2014
The 5 years ending in Q2/Q3 2007’s topping process are an obvious price analog here: the period is of the same duration as the current bull (almost to do the day); and both have run through a 100% measured move off the bottom in a very similar sequence:
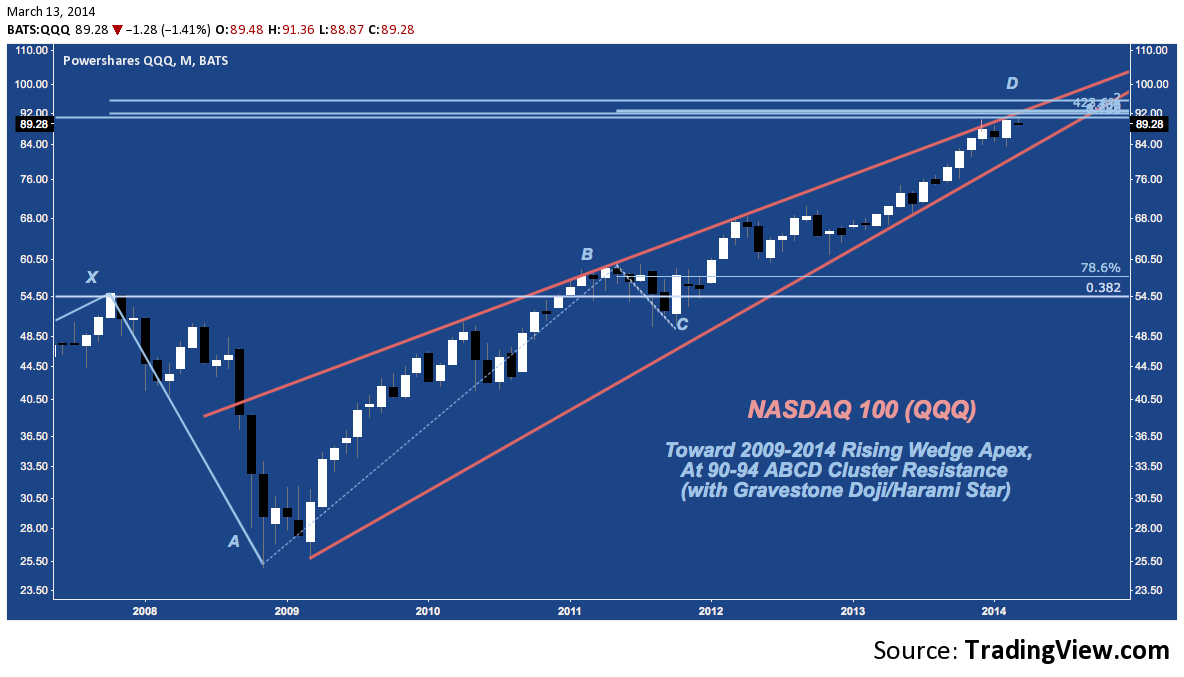
NASDAQ 100 (QQQ) – Monthly: Rising Wedge Apex
The Cubes are effectively unchanged off their December Highs at rising wedge trend line resistance. Hemming the index in on the upside is a field of cluster resistance situation between 90-94. Like the S&P, this may be healthy consolidation presaging a breakout higher; but the renewed momentum necessary to make this happen – again recalling early 2009/mid-2010/late-2011, replete with the hopes of fresh QE; and global policy intervention in the case of the latter – is absent. Any downside follow through from here finds support near 84: site December’s open, January’s low, February’s open and rising trend line support. Below the wedge, the first major support rung follows near 75; and then 68.
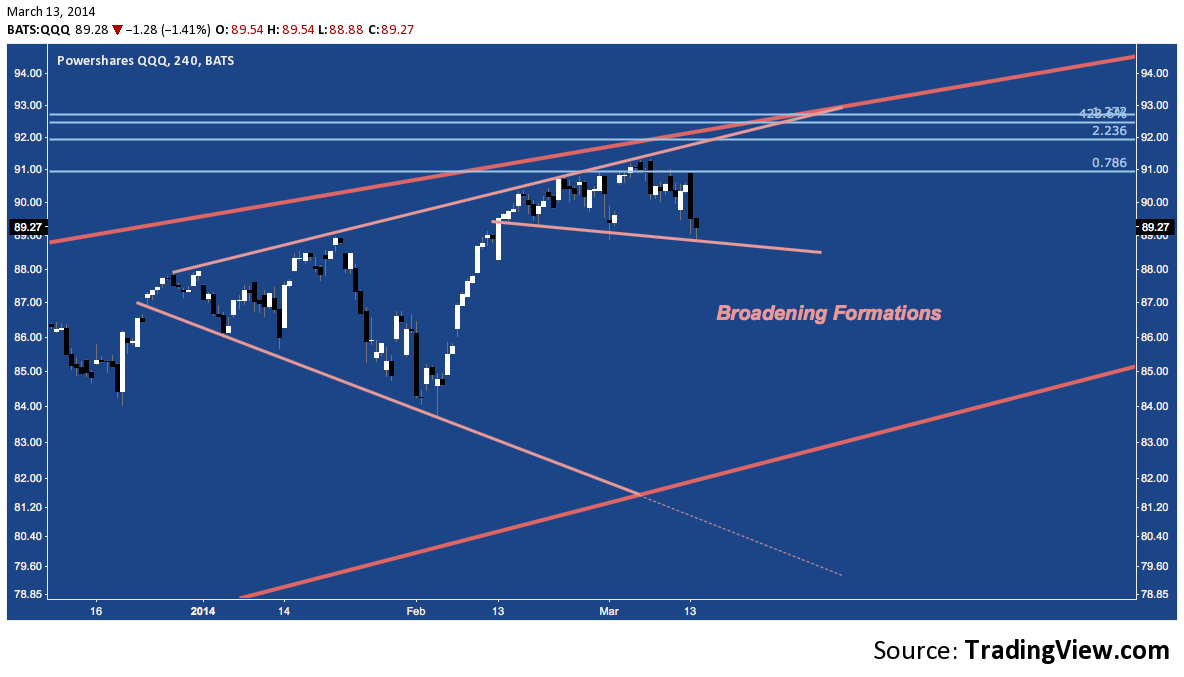
NASDAQ 100 (QQQ) – 4-Hour: Broadening Formations
As Chris Burba discussed in-depth here, QQQ is struggling below 90-94 cluster resistance with a Broadening Formation (often referred to as a “megaphone”). In fact, the churn over the last month is created megaphone-within-a-megaphone, as seen below. How this congestion pattern resolves will determine the fate of QQQ‘s 5-year wedge and whether the cluster resistance here is a brief yield or pre-correction stop sign.
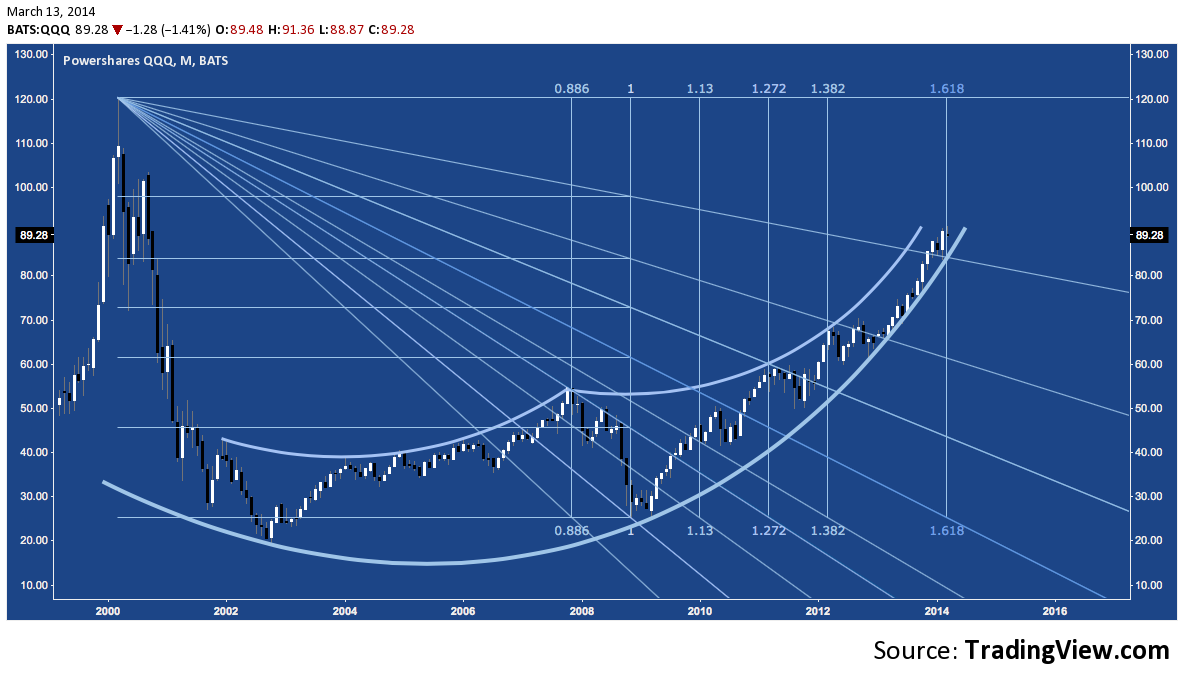
NASDAQ 100 (QQQ) – Monthly: Price and Time
The chart looks intimidating, but’s it’s import is simple: QQQ is in an ambitious rising arc and now sits at a major fibonacci time extension ratio (161.8%). These ratios often signal major trend inflection points, such as Spring 2010, Summer 2011 and Spring 2012. Going backward from 1, 88.6% tagged 2007’s top perfectly. This doesn’t forecast a drop here; only that the time has arrived again (for the first time since March 2012) to be wary.
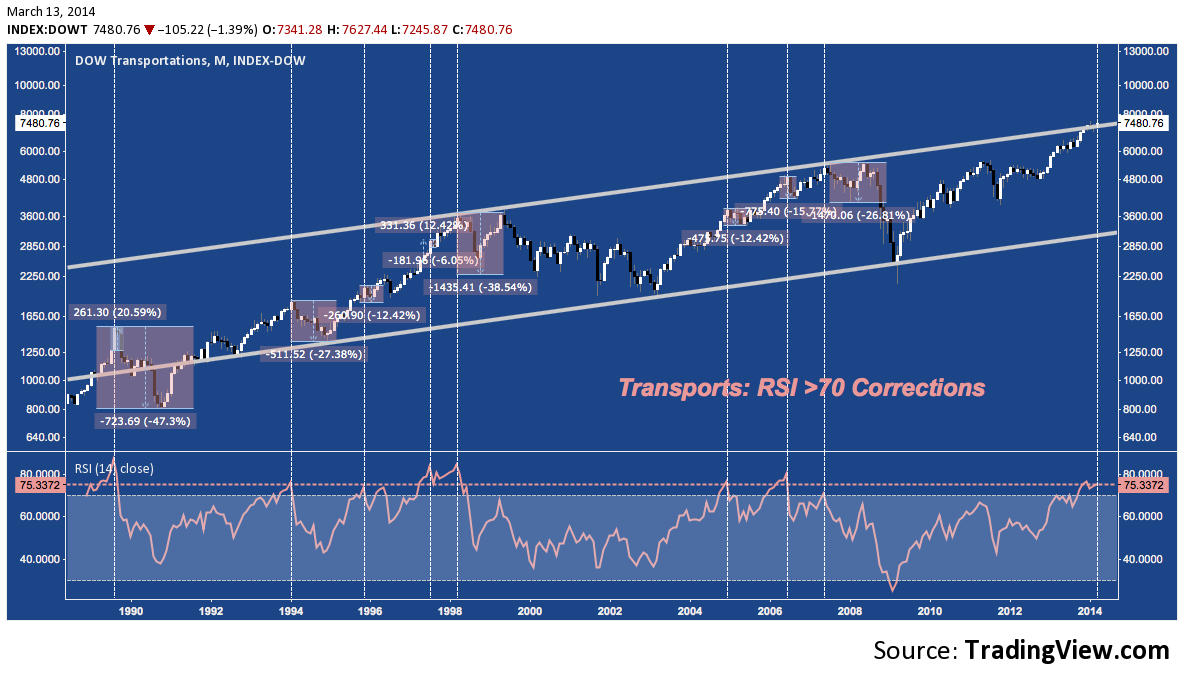
Dow Transports – Monthly: Rising Channel Resistance, >70 RSI
The Transports (DJT) are testing 16-year rising channel resistance with a monthly RSI that has been redlined (i.e. above 70) for a few months running. To derive consistent benefits from them, overbought RSI signals require vigilance and patience; and though a change in momentum doesn’t equal a change in trend, ignoring the flashing yellow light extreme RSI readings give off is perilous. Over the past 25 years, DJT‘s RSI hasn’t crept over 70 often, and when it has some fierce runs have followed before reaching exhaustion. Once that blowoff momentum is spent, however, corrections always follow. Monthly RSI has been above the current reading of 75.3 on 6 discrete occasions.
Blindly shorting on that basis has produced results both positive (1998’s signal rolled into a 38.5% correction with virtually no draw down) and disastrous (1989’s saw a 20.5% blowoff in one month before correcting 47.3%). In combination with secular channel resistance and after a record-breaking 258% run off the 2009 bottom, DJT looks overdue for a significant setback.
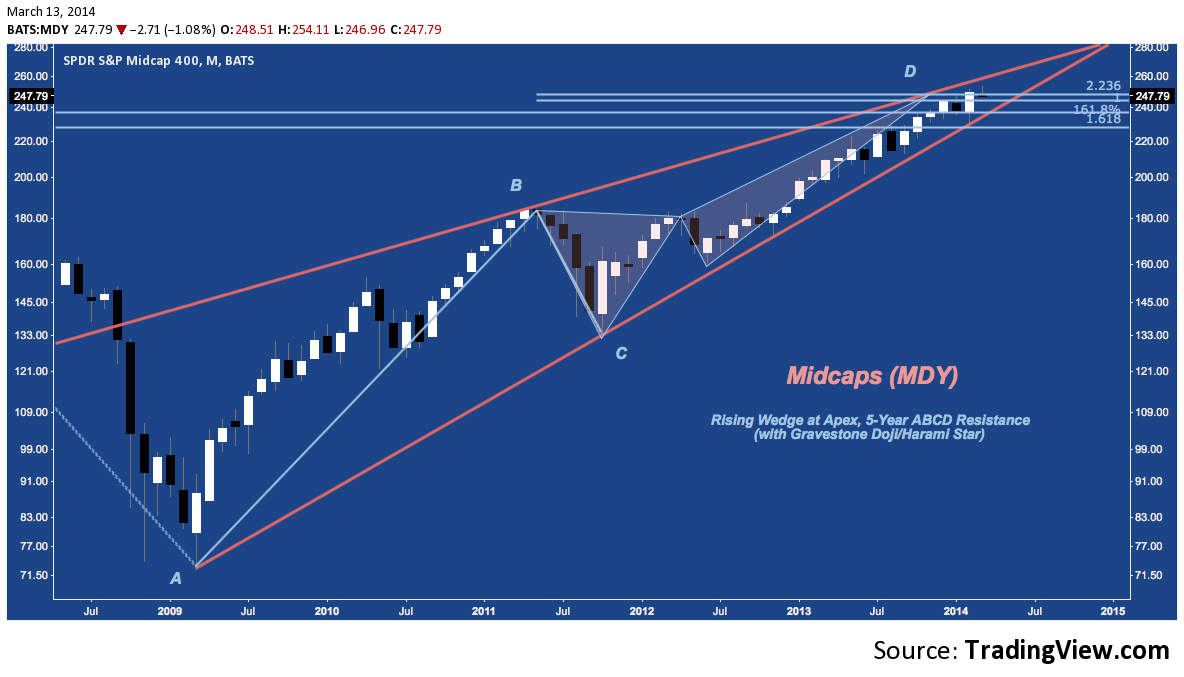
Midcaps (MDY) – Monthly: Rising Wedge, Deep Crab
Like QQQ and SPX, MDY is in a rising wedge, at multi-year cluster ABCD and cluster resistance, and has spent the last few months consolidation at a bearish harmonic pattern PRZ. MDY‘s upside line in the sand comes, with cluster resistance and rising wedge trend line support near 230.
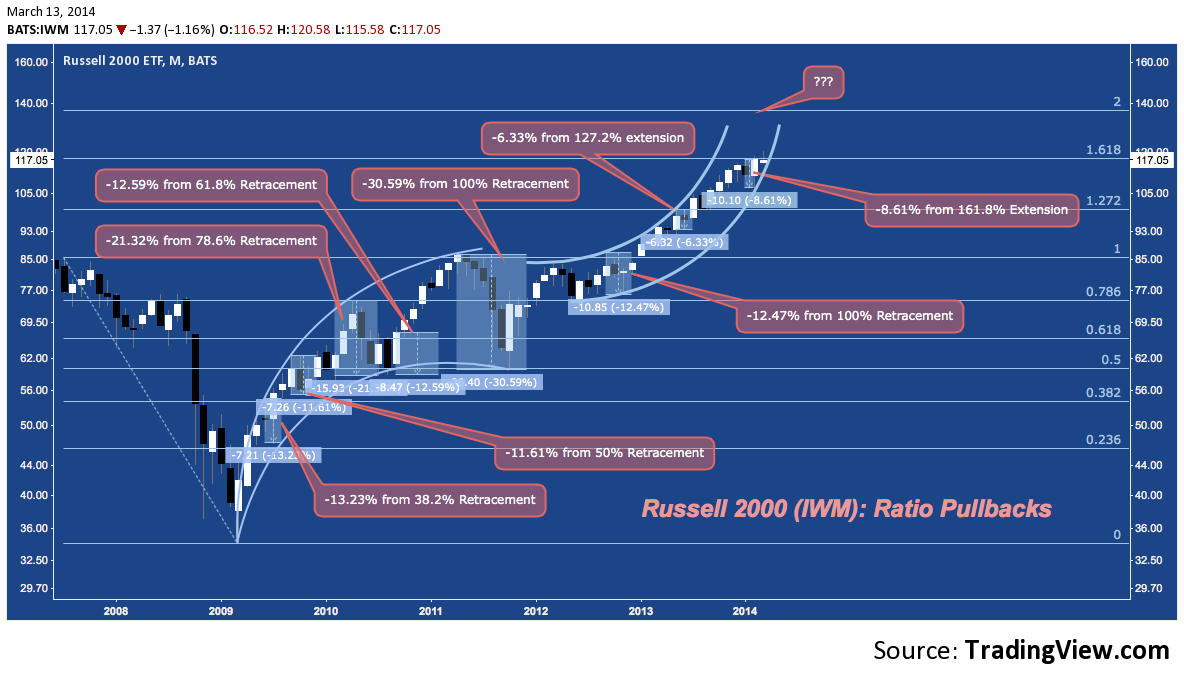
Russell 2000 (IWM) – Monthly: Ratio Pullbacks
Over the last 5 years the Russell 2000 has installed a pullback off of every retracement and extension level measuring from it’s 2007-2009 range. January-February 2014’s pullback is among the smallest in the series at -8.61%, second only to mid-2013’s -6.33%. IWM opened March by embarking above this level (near 117.50); but closed yesterday below this level. As long as 117.50 acts as strange attractor for the ETF, it begs the question: is the 161.8% extension pullback really over?
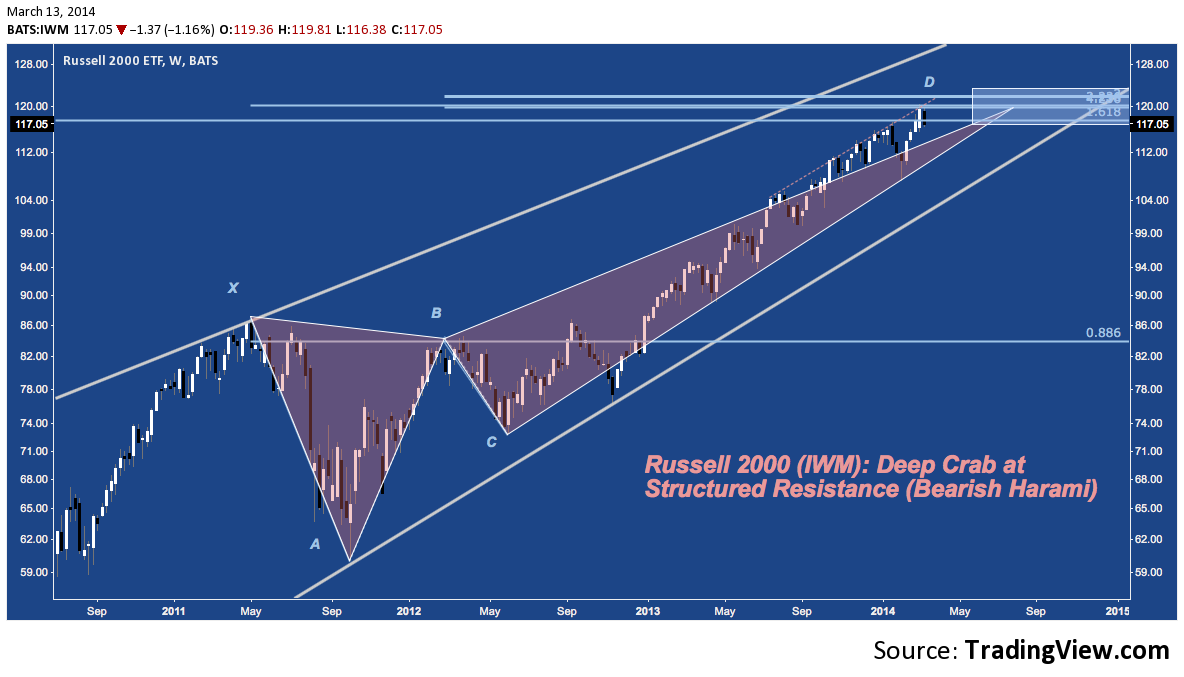
Russell 2000 (IWM) – Weekly Structured Resistance, Deep Crab
Reading from a script similar to SPX, MDY, and QQQ, IWM is pushing against structured fibonacci resistance between 117-122. This week’s harami has taken the ETF below resistance as of Thursday’s close. Trend line support comes in at 112, with major horizontal support near 108 and cyclical trend line support at 104. The Deep Crab harmonic pattern present suggests a much deeper decline toward 86 (2008/2011 high) may be in the offing beneath these levels.
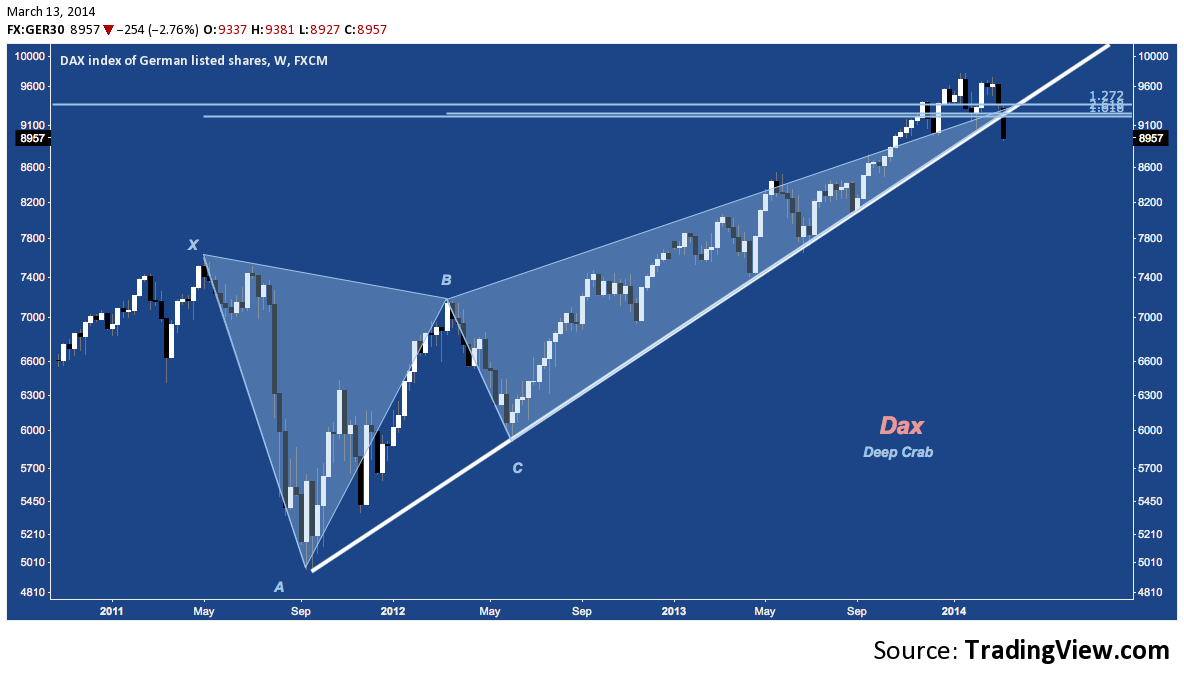
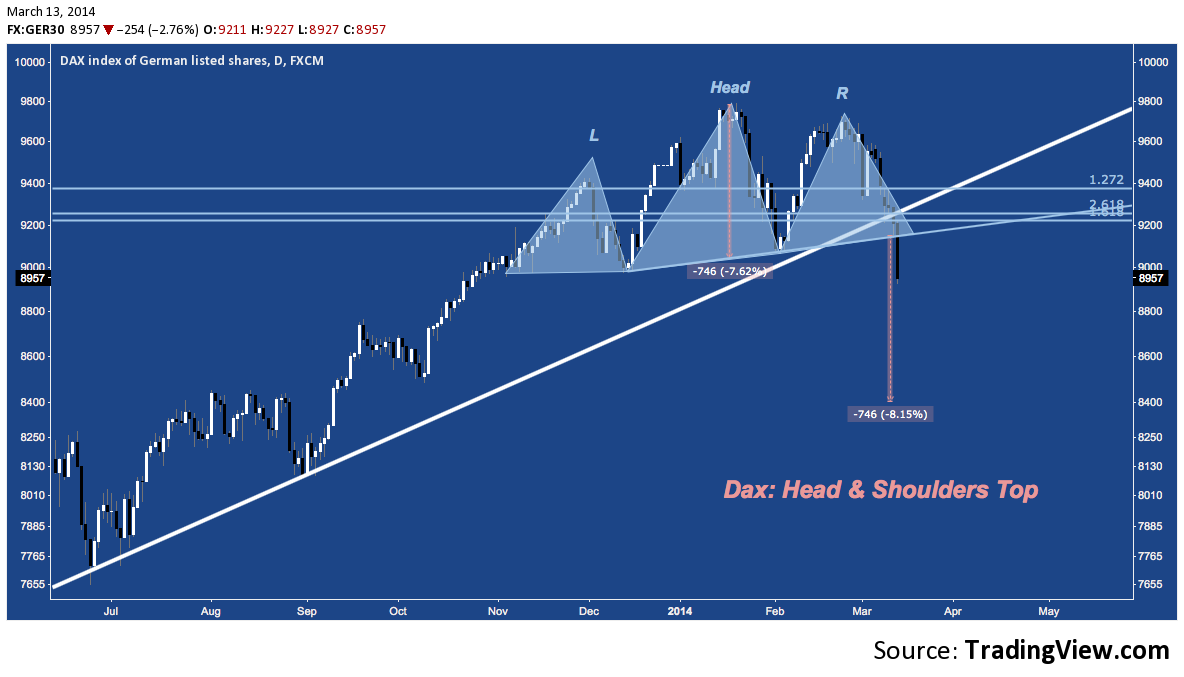
DAX – Weekly: Deep Crab
Looking abroad, the German DAX lost it’s own Deep Crab PRZ and rising trend line support off the Q3 2011 Euro-crisis low to make the first lower low since May 2013. While it’s close enough to stage a relative quick recovery, a closing violation of these technical landmarks creates a decidedly bearish tone.
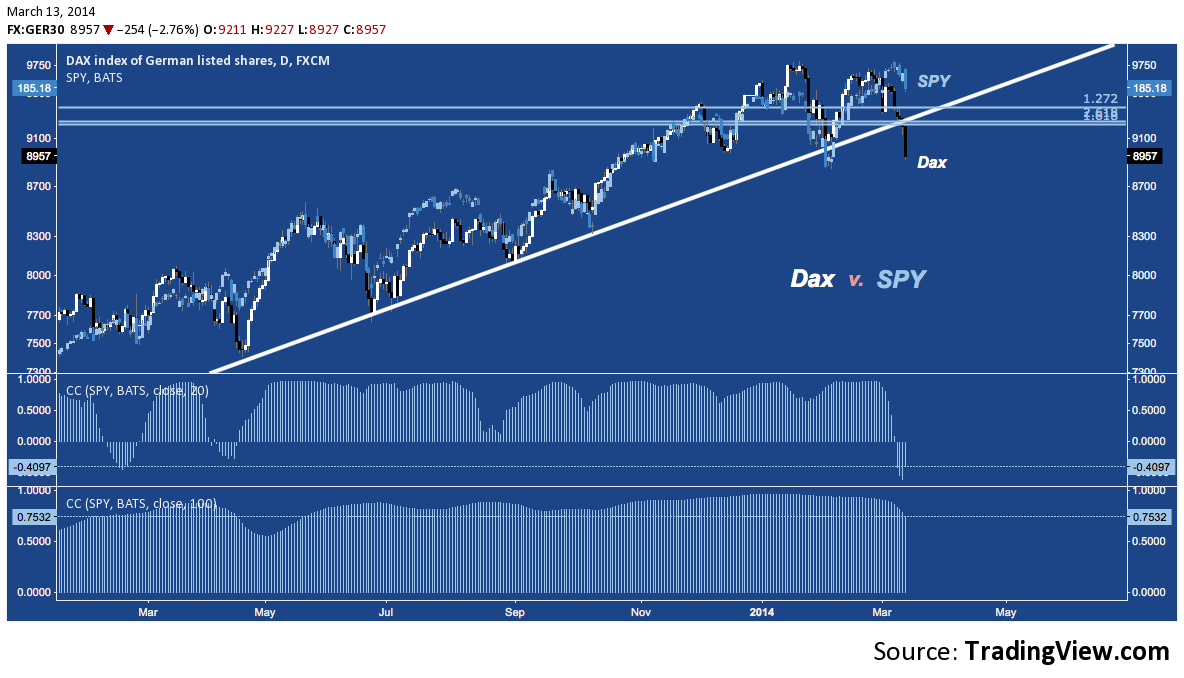
DAX v. SPY – Daily: Correlations
Monthly (20-Day) and Semi-Annual (100-Day) correlations are very tight between DAX and the S&P 500 most of the time; but occasionally the relationship falls apart as it did in Spring 2013; and is now. Last year’s breakdown saw the DAX dipping much lower than SPY on a percentage basis; and though SPY did eventually succumb by -4.3%. Now there is a more significant performance disparity on a similar correlation breakdown with DAX losing it’s rising trend line. Even if the two indices meet in between, precedent suggests SPY – even in a best case scenario – is not immune in the immediate term.
DAX – Daily: H&S Top
The operative pattern marking this week’s trend line break on the DAX is an H&S Top. Assuming the neckline holds, the pattern projects a measured move to 8400, some 6.5% lower.
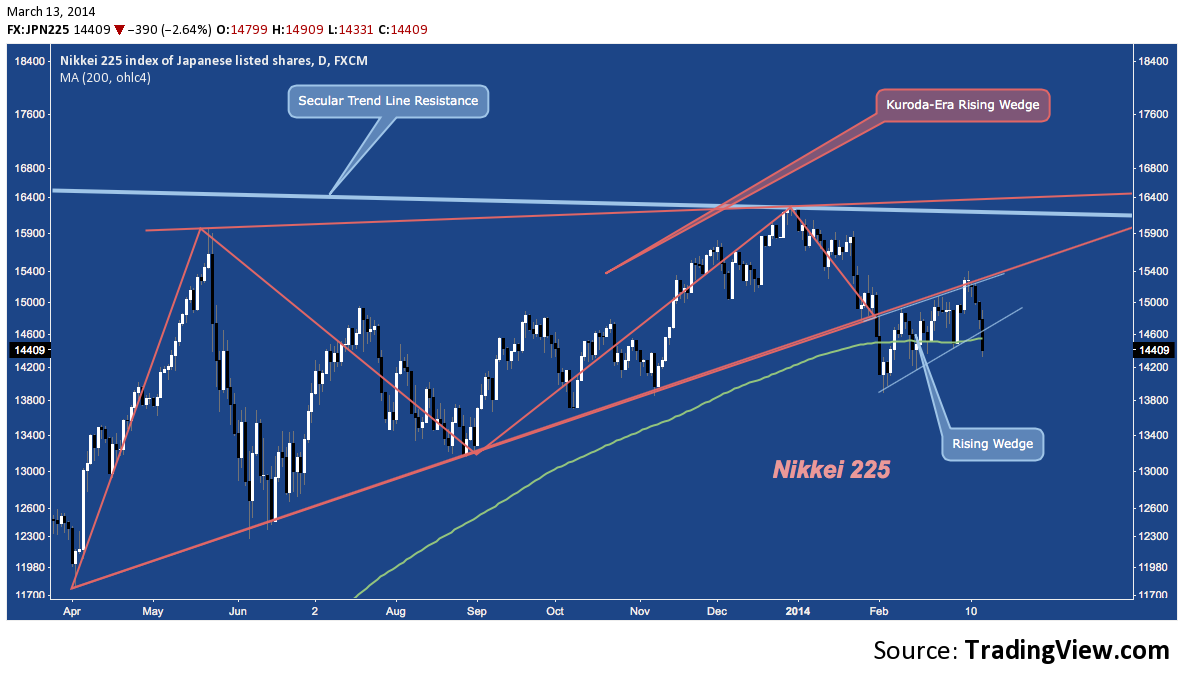
Nikkei (NKY) – Daily: Breaking Wedges
Japan’s Nikkei225 has alternated between bouts of obvious and latent weakness since late last year. Since the beginning of February, the index has been in “latent” mode, pushing higher off it’s horrible January performance but continually batted away by rising wedge support-turned-resistance. Finding support each time at the 200-Day SMA, NKY‘s attempts to regain it’s up-trend and push on to retest secular trend line resistance have created a smaller rising wedge. Yesterday, that wedge broken, and the 200-Day SMA with it. The 200-Day has been broken and retake twice in the past 6 weeks, so this development functions as a bear trap until some downside momentum builds; but the serial inability to regain last year’s upward trajectory remains bearish til proven otherwise.
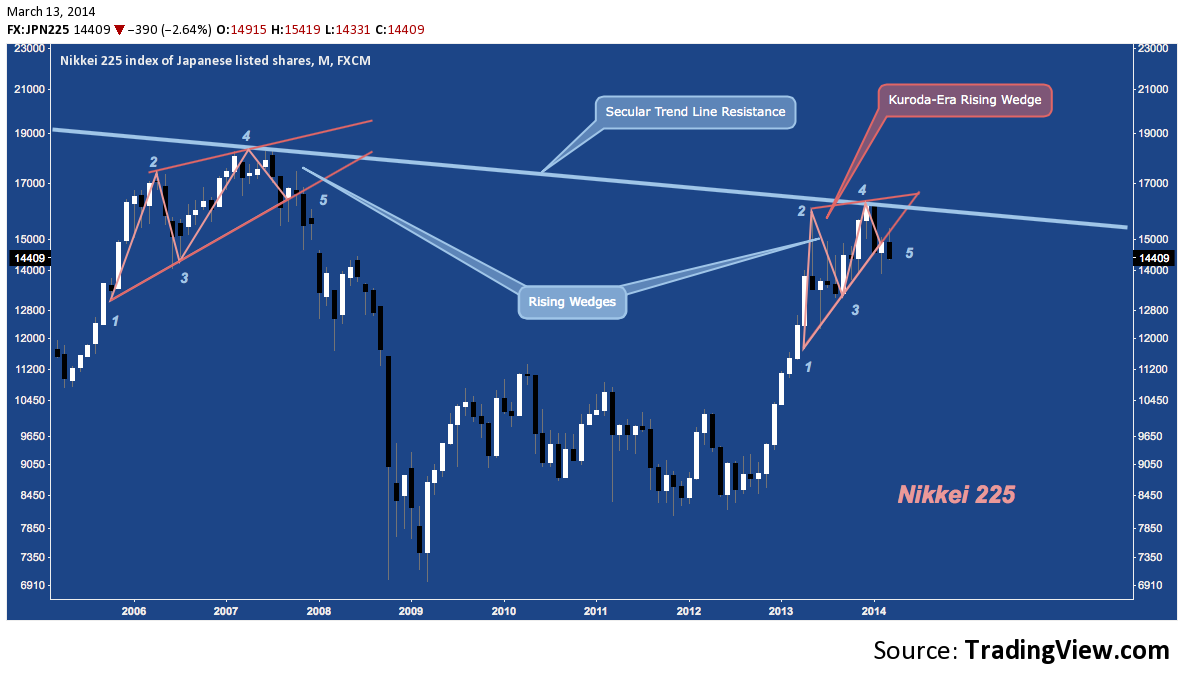
Nikkei (NKY) – Monthly: Other Rising Wedges
Speaking of 2007/2014 analogs, here’s another: NKY‘s topping structure in 2006-2007 was a 4-point rising wedge into secular trend line resistance. After pushing higher from 3 to 4, in each case the index put in an initial low, giving off some throwback consolidation (e.g. the small rising wedge discussed above) at 5. In 2007’s case, that was the deep breath before the plunge. The setup here is remarkably similar; and though the overarching policy environment is different (and rapidly proving itself to be no better), NKY does look familiarly heavy.
There are many other alternate looks to include and other indices to reference; but the theme remains the same. Stocks are at a pivotal intersection of time and price. The flat (and in some cases, already decidedly negative) performance year-to-date indicative of consolidation and indecision isn’t an accident at this time and in this place. Key global indices like the DAX, Nikkei and the Shanghai Composite (not shown) are off recent highs; and in the case of the latter two actually suffering major corrections.
US Stocks have mostly decoupled over the short-term; but domestic indices are replete with signs – some years in the making – that the likelihood of a material correction (i.e. >-10%) in the near-term is high. This isn’t to say stocks will roll over here: in fact, there’s negligible forward evidence – at least in the US a correction is now unfolding. But with major structured resistance across indices, huge rising wedges tapering to a point and multi-year harmonic patterns completing: now is the time for heightened risk awareness of how market breadth and trend integrity are faring.
Twitter: @andrewunknown and @seeitmarket
Author carries net short Russell 2000 exposure at time of publication. Commentary provided is for educational purposes only and in no way constitutes trading or investment advice.
Any opinions expressed herein are solely those of the author, and do not in any way represent the views or opinions of any other person or entity.


 Ready To Break Out?")
 Rolling Over At Key Fibonacci Level?")

")
