One of my favorite patterns to watch for near market bottoms and tops is the RSI divergence pattern. But, I must caution that it is a bit trickier than it appears. And, furthermore, I don’t recommend front-running the pattern. I tend to think of the RSI divergence pattern like a “backtest” of sorts, but in slow motion. In short, this pattern requires investor patience and discipline.
In this post, I’ll show a couple of examples and elaborate on how I use this pattern.
What Is RSI?
RSI stands for Relative Strength Index and is an indicator that highlights the current strength of a particular security. From Stockcharts Chartschool: the Relative Strength Index “measures the “speed and change of price movements.” It is considered overbought above a reading of 70 and oversold when below 30.
RSI Divergence Pattern – Components and Setup
First and foremost, you need a security or market (stocks, commodities, indices) that is extended in price to the upside or downside. Second, you need an RSI above 70 or below 30. Now, that is the easy part. This would then need to be followed by a swift price move in the opposite direction (correction), typically dropping or raising the RSI towards 50. This is then followed by another price move in the original trend/momentum direction that results in new highs/lows in price, but a non-confirmation on the RSI reading. Hence, an RSI Divergence pattern.
Examples
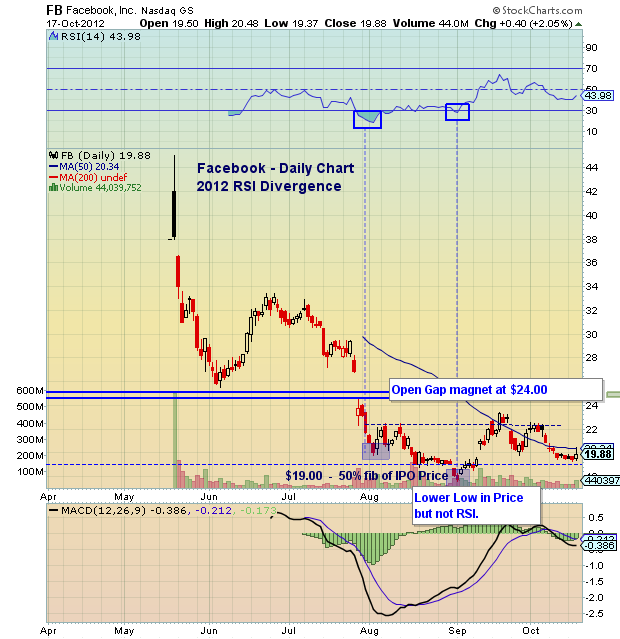
So let’s look at this setup on a chart. Sometimes a picture is worth a thousand words. Below is a chart of Facebook (FB) that I used in an October 2012 article highlighting a potential bottom in Facebook’s stock. Note that price had reached a new low, but the RSI index did not.
Facebook – RSI Divergence Pattern
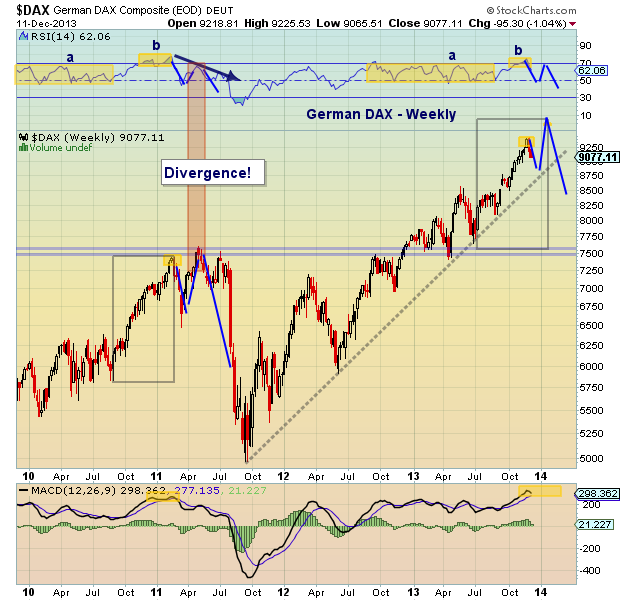
 For my next example, I’ll look at a topping pattern. In 2011, the German DAX composite was marching higher. Upon hitting an extreme overbought reading on the RSI (near 80), the DAX put in a momentum price top and began a swift pullback. This pullback was then followed by one last thrust to new highs. HOWEVER, the RSI did not confirm the price highs (failing to reach new RSI highs): This RSI divergence pattern warned that market momentum was waning. And, when the market rolled over, this lead to a deeper correction and an RSI drop back below 30.
Note that a similar pattern may be on the horizon. Whether now or in early 2014, should the DAX pull back and record an RSI near 50, investors should be mindful of the ensuing recovery. An RSI divergence pattern would emerge if new price highs followed (without new RSI highs). These patterns take time to develop so it is good to monitor them and be patient, yet disciplined, when trading the setups.
German DAX – RSI Divergence Pattern
Twitter: @andrewnyquist
No positions in any mentioned securities at the time of publication. Any opinions expressed herein are solely those of the author, and do not in any way represent the views or opinions of any other person or entity.

: Showing Some Signs of Emerging Strength")
