The first and most basic concept is this: Momentum indicators do not represent price trends. Momentum indicators represent momentum trends.
— Robert Miner, High Probability Trading Strategies
Momentum and trend: one of these things is not like the other; but in the midst of steep trends and at apparent extremes, the distinction can be a difficult one to make.
Take any book on technical analysis off the shelf and you’re likely to find some kind of implied or explicit reference to this basic technical premise: “a change in the rate at which price is changing (ROC) does not equate to a change in the direction of price.
It’s a foundational concept; but not rudimentary. Understanding the distinction is simple in theory; but the prevalence of momentum oscillators and their effectiveness at giving early notice of reversals in many market environments inculcates traders with the belief that there is a functional identity between the two. That belief will serve them well much of the time: but occasionally it reveals itself as misguided, proving very costly.
Today’s market environment is a great one to take notes on, because it demonstrates this fallacy well. Momentum indicators like J. Welles Wilder’s Relative Strength Index (RSI) are uniformly redlined above 70 – i.e. “overbought territory” – on high-beta momentum names and broad stock indices alike on almost any time frame. And yet: their trends continue higher
Take the S&P 500 ($SPX) Daily chart, plotted with its RSI and ROC indicators. The trend (top panel) has continued higher with only modest pullbacks along the way throughout 2013. But 1) the trend slope and pace moderated after January and February; and 2) though the pullbacks were minor, their presence in May, August and September adverse impact the indicator calculations.
S&P 500 (SPX) – Daily Chart: Trend Up, Momentum Down – Reason to Worry?
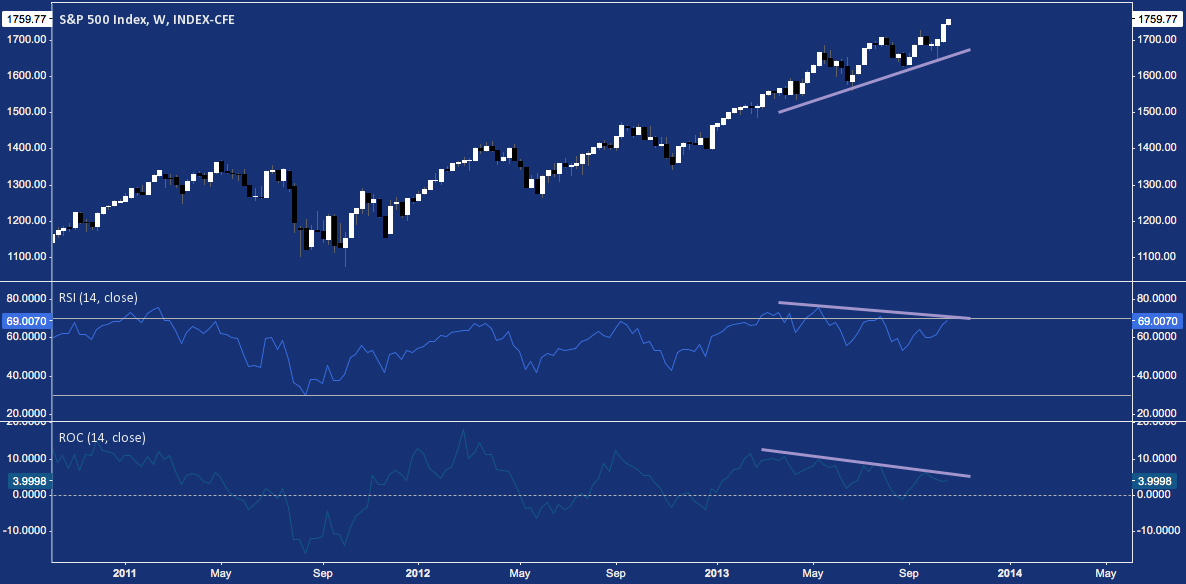
Between these two factors, then, the relative strength and rate-of-change of SPX has slackened somewhat – even while the index finished yesterday at an all-time high.
Does this render market momentum indicators useless? If the real question is, “are they the right tool to call a reversal?”: the answer is “yes”. But then, momentum is just a clue to the riddle of a market trend’s intensity and duration – only price itself is the answer.
Measures of momentum like RSI and ROC are the wrong tool to predict a reversal (some are more right, but none quite do the trick), but that hardly makes their message useless.
When the trend is up and momentum is “overbought” (a misleading term, really), there is no empirical reason to suppose a reversal is at hand. Momentum’s message here? Decisive strength.
In the case of SPX, the index is clearly slowing notably in momentum while price ticks higher. This creates a negative momentum divergence – a technical event that sometimes presages market turns – sometimes. The value of momentum here is that its decisive strength of earlier in the year has given way to a mixed picture. The intensity of the trend has changed. Perhaps SPX has simply moderated to a more sustained upward trajectory. Nothing bearish about that. Or, this SPX momentum decline may signal the demand impulse driving the market higher is tired. When this happens, the market tends to correct.
At bottom, momentum is an indicator of the quality of a trend: it’s speed, range, intensity, strength, vitality. Market momentum regimes – overbought, oversold, or trending – signal when to remain comfortable about a trend’s health; and when to sit up and take note. Thus they provide highly important, ancillary data about trends; but confirmation of continuation and reversal must be left to price alone.
Twitter: @andrewunknown and @seeitmarket
Author holds no position in any securities/instruments mentioned at the time of publication.
Any opinions expressed herein are solely those of the author, and do not in any way represent the views or opinions of any other person or entity.
Excerpt from Robert Miner’s excellent High Probability Trading Strategies, p. 11.


: Showing Some Signs of Emerging Strength")
