Netflix (NFLX) Earnings Stock Trade: Key Price Levels To Watch
Netflix (NFLX) reported earnings after Tuesday’s market close.
Although previous earnings for the company have been dreary at best with an average earnings surprise of...
Commodity Currency Pairs USDCAD NZDUSD Nearing Elliott Wave Inflections
Higher stock prices and a reversal lower in US Yields (from prior highs) are putting bearish pressure on the US Dollar.
Further weakness in...
Two Stocks To Watch Through Thursdays Trading Session
Earnings season has taken the stage for the next couple of weeks as the market steadies itself for another move higher.
Of course, another push...
Bitcoin Rally Facing Important Fibonacci Breakout Resistance!
Can anything stop Bitcoin's rising tide? We may know soon.
Bitcoin's recent run-up to over 60,000 is testing its 2020 highs and a key Fibonacci...
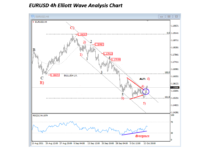
Is Euro EURUSD Reversing Higher Off At Elliott Wave Support?
Higher US treasury bond yields are causing some reversals in the market, with metals rallying while the US Dollar is lagging. Even better examples...
What Causes “Transitory” Inflation to Become “Persistent”?
You are the CEO of Acme Widget Factory. Among your many duties is overseeing production and profit margins related to your core product, widgets....
Will Federal Reserve Admit They Are Wrong About Transitory Inflation?
For the past year, the Federal Reserve has stuck to its guns on the idea that supply-chain disruptions are causing a short-term increase in...
Global Equities Market Capitalization $30 Trillion Higher Than Pre-Pandemic
The stock market advance over the past year has truly turned a lot of heads, in a good way.
After the initial bear market and...
Key Sector ETFs Hover Over Price Support While Stock Indices Flounder
On Monday, we talked about specific sectors weakening as they teetered on the edge of support from their major moving averages.
The main three sector...
Q3 Earnings Outlook: Expectations Are Trending High
The following research was contributed by Christine Short, VP of Research at Wall Street Horizon.
Q3 Earnings Outlook Executive Summary
- Third quarter earnings season kicks...


