Netflix (NFLX) reported earnings after Tuesday’s market close.
Although previous earnings for the company have been dreary at best with an average earnings surprise of less than half a percent for the past three quarters, investors are now looking for a major improvement in coming quarters. Not sure that happened just yet but the stock is in the spotlight today.
The most common cause for bullish sentiment comes from Netflix’s newest international hit show Squid Game. The Korean survival-game series has quickly grown into one of the company’s largest shows to date. Bloomberg estimated the show to be worth over $900 million for Netflix.
Ignoring recent developments, Netflix has struggled with the rising costs for content creation, especially as the ‘streaming wars’ have put a huge amount of competition in the industry.
Therefore, Squid Game may be the shift in momentum Netflix has been searching for, as the company now has a large new moneymaker under its belt.
As for investors, Squid Game has created much-needed hype around Tuesday’s earnings and future earnings reports. However, one thing to note is that profits and potential future revenue from the series will likely be reflected moreso in the following earnings season, as the show aired fairly recently on September 17.
Nonetheless, traders are still watching for potential buying opportunities.
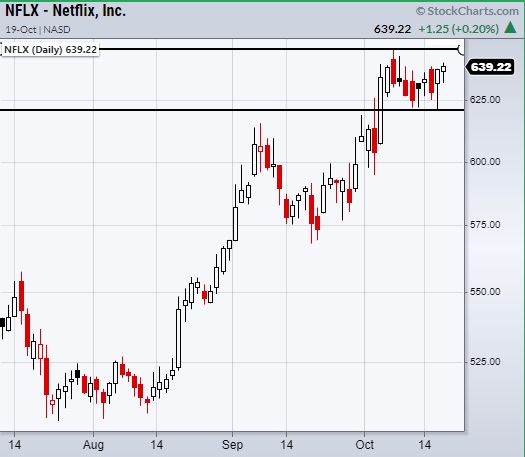
Taking a close look at the above chart, NFLX has gone through multiple breakouts from prior consolidation areas.
Each breakout has thus far created a great buying opportunity from the momentum side.
Now, NFLX is coming up to yet another potential breakout once it clears the highs from 10/7 at $646.84.
This could create a great buying opportunity.
Depending on how Netflix’ earnings are received by the market, we will find out if the company truly is building momentum, or if recent success has just been a case of “buy the rumor, sell the news” leading into today’s earnings event.
A trade through the recent high is best taken as a more active trade with tight risk to under the 10-Day moving average at $632.23 or under the recent consolidation area around $620.59.
Furthermore, even if we experience a price gap, keeping $646.84 and $620.59 in mind as key prices for either support or resistance depending on the gap will come in handy for anyone looking to take a more active position in NFLX following earnings.
Watch Mish’s latest appearance on Coindesk!
Stock Market ETFs Trading Analysis:
S&P 500 (SPY) 454.05 high to clear.
Russell 2000 (IWM) Holding pivotal 225 area.
Dow (DIA) 356.60 high to clear.
Nasdaq (QQQ) 369.61 support the 50-DMA.
KRE (Regional Banks) 71.75 resistance area.
SMH (Semiconductors) Confirmed bullish phase change with second close over the 50-DMA at 264.16.
IYT (Transportation) 255 support area.
IBB (Biotechnology) 160 resistance. 153.38 support.
XRT (Retail) 93.73 resistance from 50-DMA.
Twitter: @marketminute
The author may have a position in mentioned securities at the time of publication. Any opinions expressed herein are solely those of the author and do not represent the views or opinions of any other person or entity.


