S&P 500 Bearish Triangle May Lead To Additional 8% Decline!
The financial markets remain volatile as inflation, supply chain issues, and serious geopolitical events cloud the immediate future.
This volatility has manifested itself into a...
Timing Trade Entries On Fast Paced Sector ETFs
The past couple of weeks have given us a new range to watch in the stock market.
A positive jobs report has been seemingly muted...
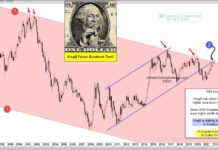
3 Times a Charm? U.S. Dollar Facing Breakout Test!
Over the past few decades, the U.S. Dollar has been weakening.
Could this weakness be coming to an end?
Today's long-term "monthly" chart highlights an important...
Gold Miners (GDX) Look Ready To Move Higher
Gold prices are pushing higher as as the war in Ukraine takes centerstage.
And as gold prices move higher, it only adds fuel to the...
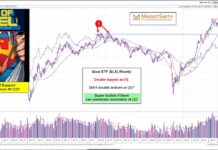
Are Steel Prices About To Explode Higher?
Geopolitical tensions surrounding the Russia/Ukraine war have sent steel prices higher.
And if the rally continues, it may mean considerably higher steel prices and added...
Stock Market Outlook Clouded By Volatility
Stock market volatility continues as prices move up and down on a daily basis creating frustration for investors.
The S&P 500 Index fell by 1.55%...
Semiconductor Stocks Trading At Critical Inflection Point!
Over the past two decades, it's fair to say that semiconductor stocks have been an important part of the technology space.
This is true from...
Can Stock Market Hold Up Amidst Soaring Commodities?
Last week the major indices made a successful rally back into a short-term support area. However, many see the price move as a rally back...
Regional Banking ETF (KRE) Confirmed Bullish Phase Change
The Regional Banking ETF (KRE) has made two consecutive closes over its 50-Day moving average confirming a bullish phase change.
KRE is also the only...
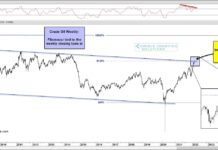
Crude Oil Prices See Volatility At 61.8% Fibonacci Resistance!
The geopolitical scene across the globe is gathering intensity as western countries and leaders clamp down on Russia for sending troops into Ukraine.
This has...


