Over the past two decades, it’s fair to say that semiconductor stocks have been an important part of the technology space.
This is true from an investing and economic perspective.
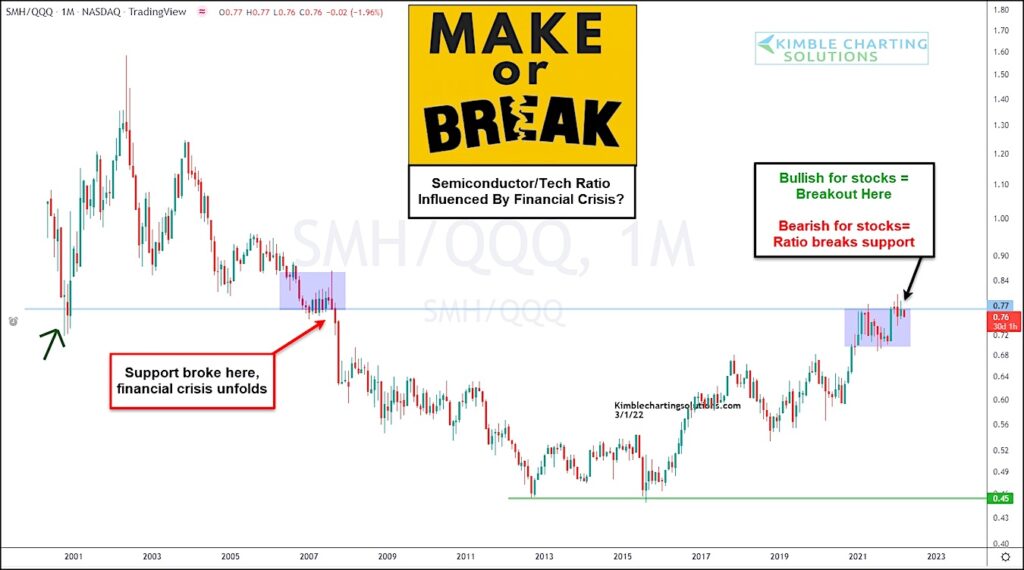
Today’s chart looks at a long-term view of the ratio of the Semiconductor ETF to the Nasdaq 100 ETF to highlight semiconductors relative performance… and why it’s important to watch right now!
As you can see, semiconductors big disconnect and decline lower occurred during the financial crisis leading to under-performance through 2015. This was also a period of economic underperformance.
Since then, the semiconductors have shown leadership in outperforming the Nasdaq 100. This has lead to a rally back to (and briefly above) the key financial crisis breakdown area.
Make or break message to tech and broad markets???
Seems like an important area for investors (and consumers) to watch. A breakout here = bullish for stocks/economy, while a breakdown here = bearish for stocks/economy. Stay tuned!
Semiconductors (SMH) to Nasdaq 100 (QQQ) Ratio Chart
Note that KimbleCharting is offering a 2 week Free trial to See It Market readers. Just send me an email to services@kimblechartingsolutions.com for details to get set up.
Twitter: @KimbleCharting
Any opinions expressed herein are solely those of the author, and do not in any way represent the views or opinions of any other person or entity.


