Why the Stock Market Is At Record Highs
The S&P 500 (NYSEARCA: SPY) and Nasdaq 100 (NASDAQ: QQQ) continue to drive this market higher.
Note how far above the price is from their...
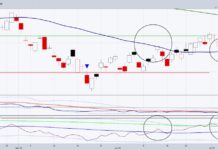
Russell 2000 Index Looking Up At Resistance
It's been a nice comeback story for the stock market.
Early in the year, stocks were down and uncertainty high. But from there the 'wall...
Key Stock Market Indices & ETFs: Minding July Trading Ranges
Over the weekend I wrote about the July 6-month calendar range reset happening this week!
Our inside sectors of the US economy, retail (Retail Sector...
This Week the July 6-month Calendar Range Resets
First some facts about the July Calendar Range
The July PatternThe Six-Month Calendar Ranges
Provides directional bias for the next 6 to 12 months.
January and July...
Lower Interest Rates: A Big Piece of the Inflation Puzzle
With FOMC minutes published today, most Fed members eye rate cuts this year, but are split on what are the next steps.
One must cynically...
Is The U.S. Economy Facing Stagflation Or Disinflation?
Given how loosely all the title terms are used, let’s start with the definitions of each.
1. Disinflation
Definition: A slowdown in the rate of inflation—prices are...
Bitcoin Trading Breakout Points To Higher Prices
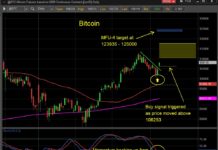
Bitcoin bulls are ready to ride again.
After pulling back to an important price support zone and getting oversold, Bitcoin has hooked up and triggered...
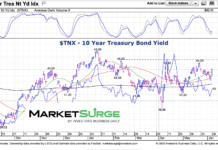
10-Year Treasury Bond Yield in Sideways Pattern
There has been a lot of chatter about interest rates. And investors would love to have clarity on this issue.
But, it's almost better as...
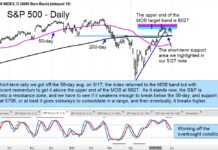
S&P 500 Index Reaches Upper Price Resistance Band
The S&P 500 Index has rallied sharply off the April low.
That said, it has reached an important short-term price resistance area at its MOB...
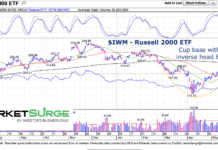
Is Russell 2000 Building Bullish Base?
It's been some time since the Russell 2000 has been an out-performer.
And, although we propose a potential bullish pattern on the small cap Russell...


