The VIX Volatility Index (INDEXCBOE:VIX) has fallen sharply over the past few weeks. This has caused some buzz and merits some additional digging.
Might be time to let up on the short volatility trade…
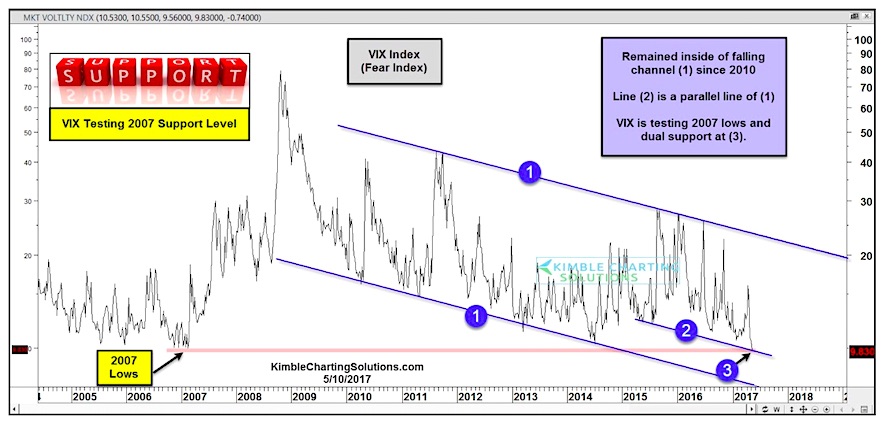
The chart below looks at the VIX Volatility Index over the past 10 years or so. And as you can see on the chart below, the VIX has remained in a descending channel (point 1) for the past 7 years. But the VIX latest drop is at a critical confluence of support comprised of a parallel support line (point 2) and the 2007 lows (point 3).
The 2007 lows?!? The last time the VIX hit this level in 2007, it jumped.
This price level could become a very important level for the VIX index and potentially could send an important message to the bullish trend in stocks. Best to keep this indicator on your radar.
VIX Volatility Index – Testing 2007 lows!
Thanks for reading and have a great week!
ALSO READ: Are Bank Stocks Losing Momentum?
Twitter: @KimbleCharting
Any opinions expressed herein are solely those of the author, and do not in any way represent the views or opinions of any other person or entity.

: Cup (and Maybe Handle) Watch")
 Reaches Important Price Support")

