I have used monthly charts to determine support and resistance levels.
Moreover, this timeframe is often the best indicator for either the end of a countermove or the start of a bigger megatrend.
The 23-month moving average (blue) and the 80-month moving average (green) are my go-to’s.
One is a shorter 2-year business cycle while the other is about a 6–7-year business cycle.
Here are a bunch of monthly charts that have my attention.
Often, a picture says 1000 words.
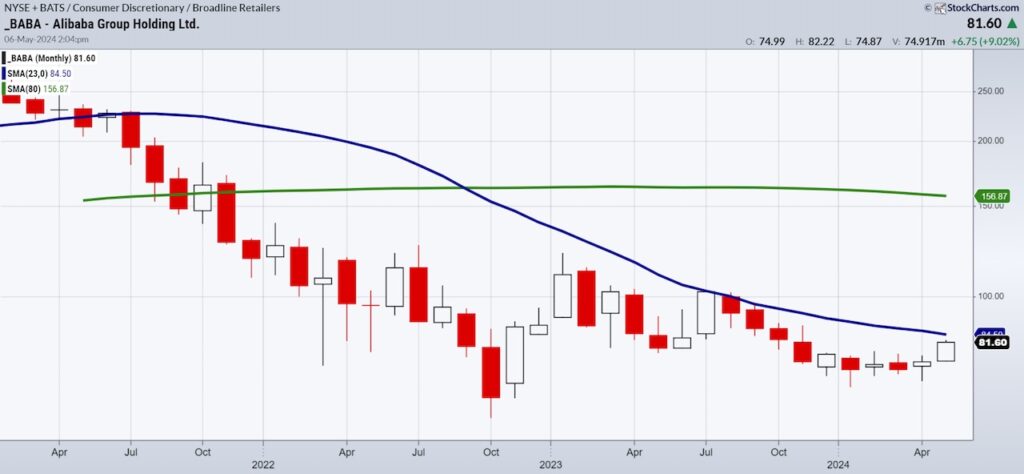
Alibaba (BABA)-the end of the correction or the start of a much bigger move? BABA has traded below the 23-month moving average since 2021.
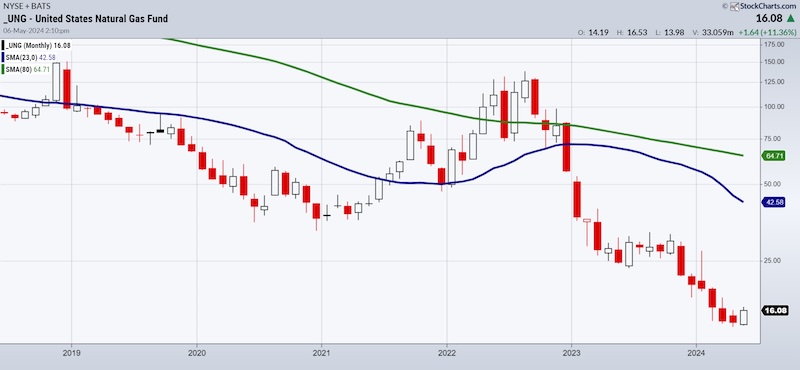
Natural Gas-sure get bullish-but the road back to the monthly MAs is long and perilous for now.
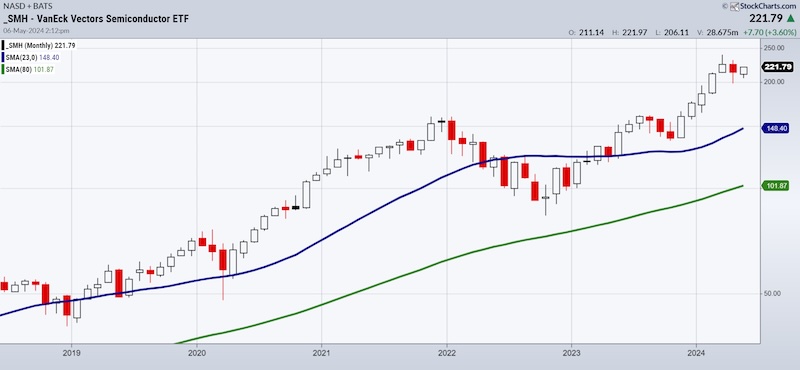
Semiconductors-Sure we will see corrections. But the trend is quite clear and will not give us any pause until it breaks under 160.
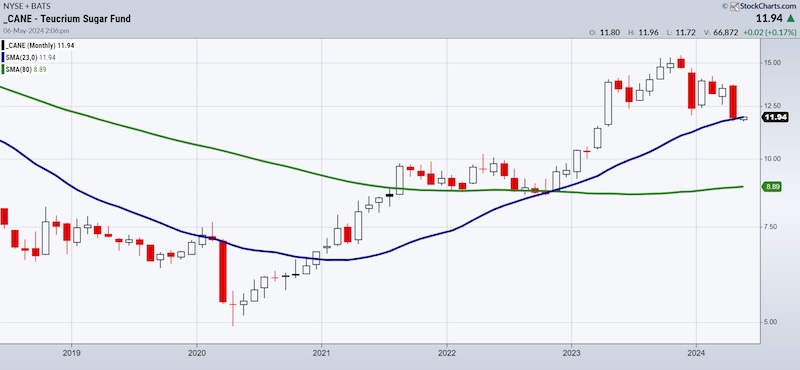
The ETF for sugar. It gave us a great signal in 202. Now, with May sitting around the 23-month MA, is the move over?
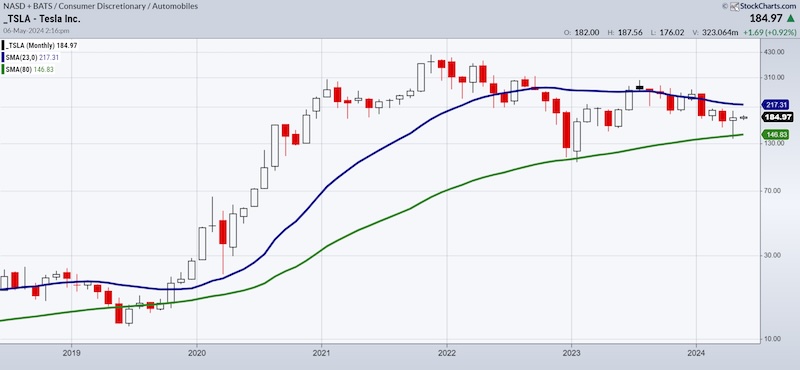
How clear is this? Tesla is below the 23-month MA but above the 200-month MA.
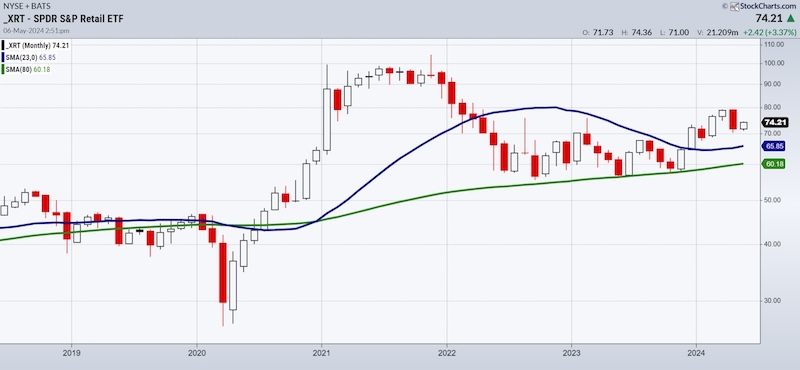
What about Granny Retail XRT?
Above the 23-month so in expansion. But also having an inside month to May.
Best we can say from the chart- Granny looks constructive and we err to bullish. But there is more to prove.
Twitter: @marketminute
The author may have a position in mentioned securities at the time of publication. Any opinions expressed herein are solely those of the author and do not represent the views or opinions of any other person or entity.


