Many seem to be talking about the growth/reflation theme that has taken place post election. Did this theme really start improving post election?
The chart below would put a little question into the date. Below looks at the TR Commodity index over the past 40-years.
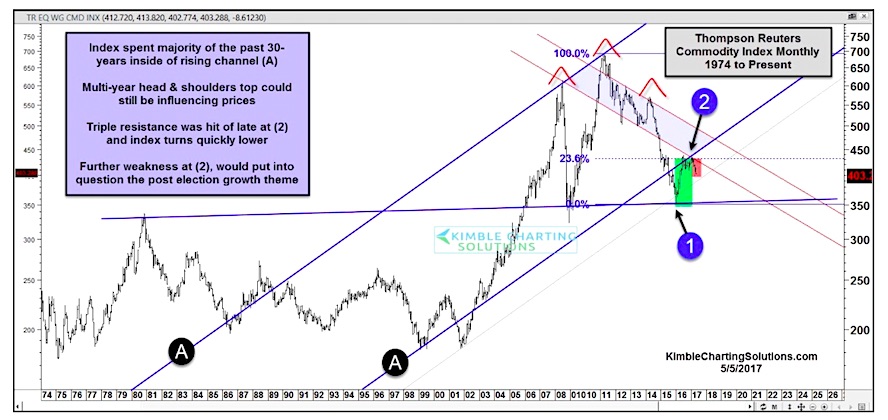
The index hit support at (1) and started to moving higher. When did the index hit a low last year on a monthly closing basis? The monthly low took place at the end of February 2016, 9-months “before” the election.
The index remains in a bearish downtrend since the highs back in 2011, which looks to have formed the head, of a multi-year head & shoulder topping pattern. The swift decline that started in July of 2014, took it down to support at (1). This is where a counter trend rally started, that many call the reflation/growth rally. Regardless of what label one wants to put on the rally, the index did hit triple resistance in a downtrend at (2) and has turned south of late.
The growth/reflation theme would be put into question, if neckline support at (1), would happen to give way! A support break at (1), would suggest that dis-inflation or de-flation is in play.
So far weakness in the index since the highs back in 2011, has not impacted stocks in a negative way at all. Stocks and this index did bottom together at (1) and both have struggled a little, as resistance was hit at (2) in the chart above.
Thanks for reading.
ALSO READ: Gold Miners ETF (GDX) At Critical Juncture
This post originally appeared on Kimble Charting.
Twitter: @KimbleCharting
Any opinions expressed herein are solely those of the author, and do not in any way represent the views or opinions of any other person or entity.


 and Semiconductors (SMH): Concerning Price Pattern?")


