Before we enter into a currency trade, we first want to know what the Dollar Index is doing. Having a good forecast for DX helps us identify the tradable moments in other currencies and to enter trades with confidence.
If you took advantage of our bullish forecast for the Dollar Index back in November when it was testing resistance near 96.75, perhaps by shorting the Euro or the Yen, now is a good time to consider taking profits or otherwise managing your trade.
Meanwhile faster traders might be looking for some higher risk countertrend currency trades during the next several months, and an expected correction in DX can help inform the timing of those trades as well. (Note we wrote about the Yen last week.)
The Dollar’s rally during the first half of 2022 played out mostly as we described in the earlier post, although it was more energetic than we expected. The index worked quickly to challenge the first major target at 98.91 and has now moved into a higher range of target resistance levels near 104.24 and 105.60.
On a weekly chart, it’s possible to count five waves up as [I]-{II]-[III]-[IV]-[V] internal to wave ‘iii’. Also on a daily chart (not shown here), we can count five waves up internal to wave [V] of ‘iii’.
This means we think the Dollar is overbought here and a correction due. However we also note that our preferred momentum indicator has not yet registered a negative divergence on a weekly time frame against the steeply rising price.
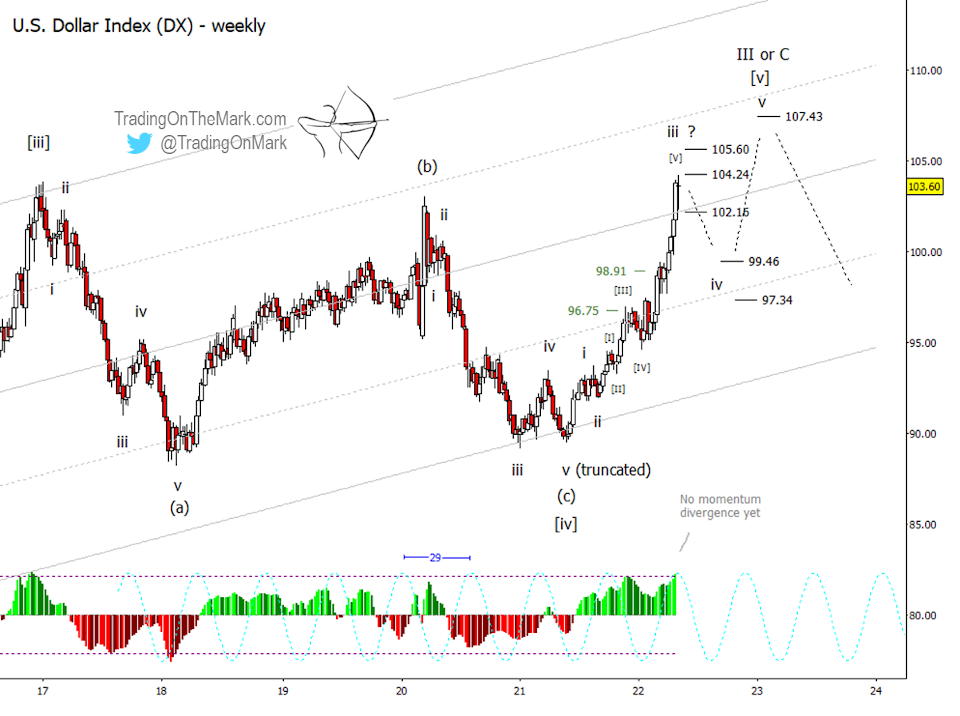
When trading inside an Elliott wave correction, it’s important to speed up your trading time frame. You can expect to play for smaller moves that don’t last very long. Potential Dollar bears might find that price action is choppy above support at 102.16, and a break of that level might result in a faster trip down to 99.46 or even 97.34.
We still think the Dollar Index pattern calls for another attempt at a high later in the year or early in 2023. The 29-week cycle has its next ideal low in late August and its next ideal high near the start of December. It’s also common for currencies to change trends near the turn of the year.
You can get daily charts and updates for this and other highly traded markets via our subscription page on Substack and on Twitter.
Twitter: @TradingOnMark
The authors may have a position in the mentioned securities at the time of publication. Any opinions expressed herein are solely those of the author, and do not in any way represent the views or opinions of any other person or entity.
: Creating Bullish Divergence?")

 and Semiconductors (SMH): Concerning Price Pattern?")
 and Semiconductors (SMH): Concerning Price Pattern?")


