If you took advantage of our bearish forecast for the Japanese Yen last summer, it’s time to start thinking about how to take profits. The recent decline has reached a near-term support area, while on a larger scale the decade-long declining pattern appears to be approaching its end.
Once again we use the Invesco CurrencyShares Japanese Yen Trust, NYSEARCA: FXY, to show how the next moves could play out.
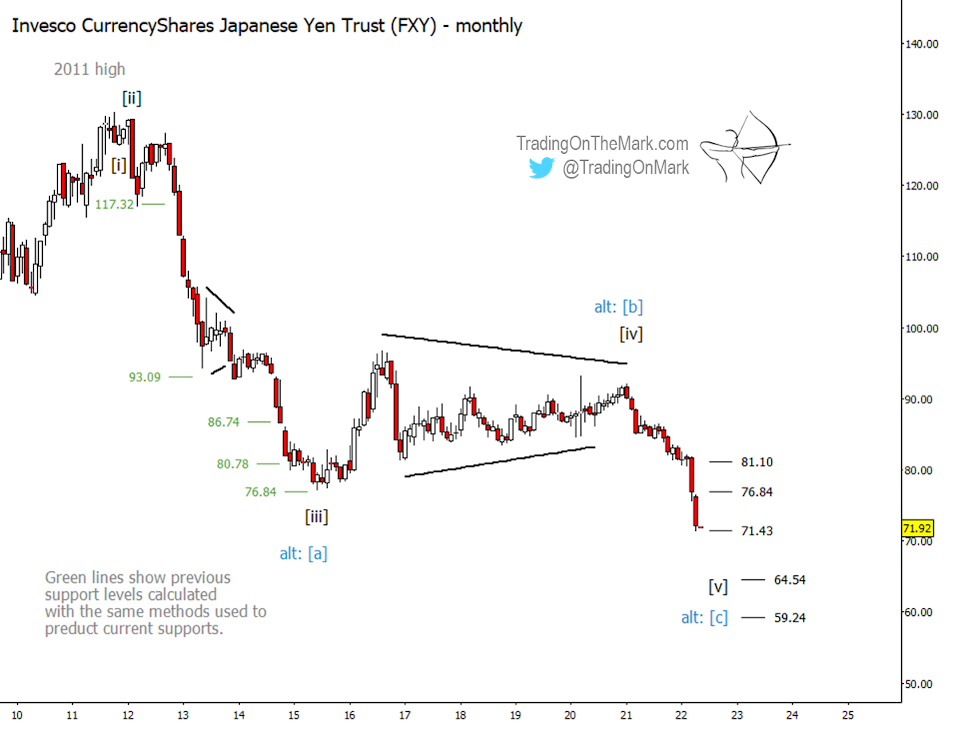
We think the decline from 2011 counts best as a five-wave impulse, but it’s also possible to count a three-wave correction. For traders operating on a monthly time frame or faster, the distinction is probably unimportant.
A major feature of both the primary and alternate wave counts is that the period from 2015 until 2021 represented an Elliott wave triangle, which was in the position of either wave [iv] or wave [b]. The breakout decline after the triangle appears impulsive.
On the monthly chart of the Japanese Yen (below) we show some nearby and projected support targets, noting that 71.43 is being tested now. Lower supports include 64.54 and 59.24, although we expect to see some sideways or upward consolidation before price attempts to reach them.
We also show how similar support levels worked well in earlier parts of the pattern.
A weekly chart allows us to calculate supports with more precision. Key levels going forward include 71.01 and 65.30. Previous support at 75.50 might serve as resistance if price bounces in a small wave (iv) during the next several weeks or months.
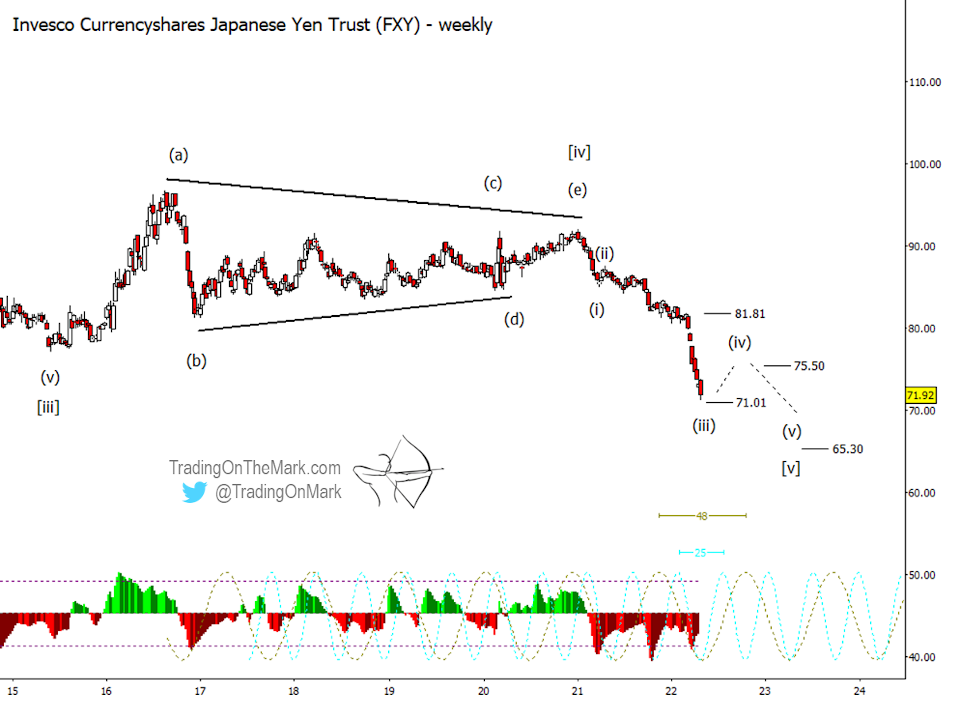
Based on the shorter 25-week cycle, potential inflection times include May 2022, late October 2022 and April 2023. We can imagine Elliott waves (iii), (iv) and (v) of the decline fitting with those dates, but it’s not the only timing scenario.
Note the momentum indicator is showing some positive divergence against price right now.
You can get daily charts and updates for this and other highly traded markets via our subscription page on Substack and on Twitter.
Twitter: @TradingOnMark
The authors may have a position in the mentioned securities at the time of publication. Any opinions expressed herein are solely those of the author, and do not in any way represent the views or opinions of any other person or entity.


