When we last wrote about the U.S. Dollar in January 2021, we were expecting a sizable bounce. The bounce occurred from very near the support area we identified, although the area was tested twice before price really took off.
We’re still bullish on the Dollar, and today’s post provides a revised Elliott wave count for the U.S. Dollar Index (symbol DXY). The question is which scenario is working – the bullish scenario or the even more bullish scenario.
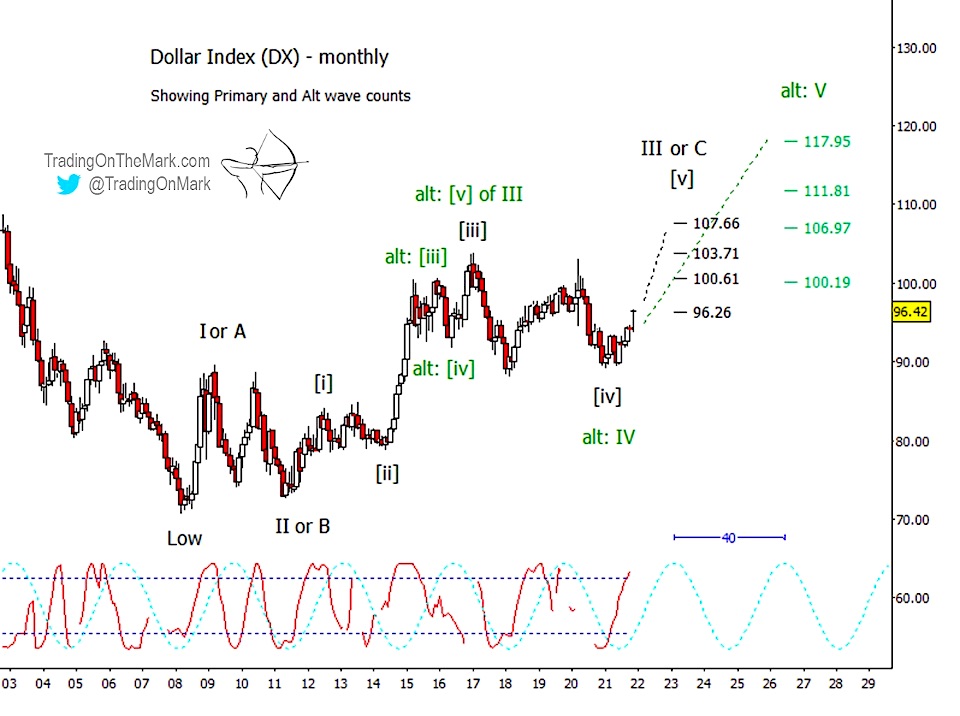
For context, we need to consider the series of higher lows that have printed since 2008. Our primary wave count (shown in black on the monthly chart below) treats the structure as either a three-wave or five-wave move, with price currently trying to rise in the last stages of big wave III or C. In this view, we might yet see big waves IV and V during the next decade, but it’s too soon to say. Regardless, the best trades inside wave III are still likely to be upward.
Keeping with our primary scenario, price appears to be climbing out of sub-wave [iv] of III or C. Using Fibonacci multiples of the height of the earlier wave [i] identifies approximate resistance areas at 96.26, 100.61, 103.71 and 107.66. As you see, price is currently testing the lowest of those, although we expect it to break through sooner or later.
Note that the next swing of the 40-week dominant cycle (light blue) on the monthly chart suggests the index is going into a period of upward pressure. Meanwhile, the Lomb periodogram (red) suggests the rise could use at least a minor correction from near the current area. If we get that correction, it could become a buying opportunity.
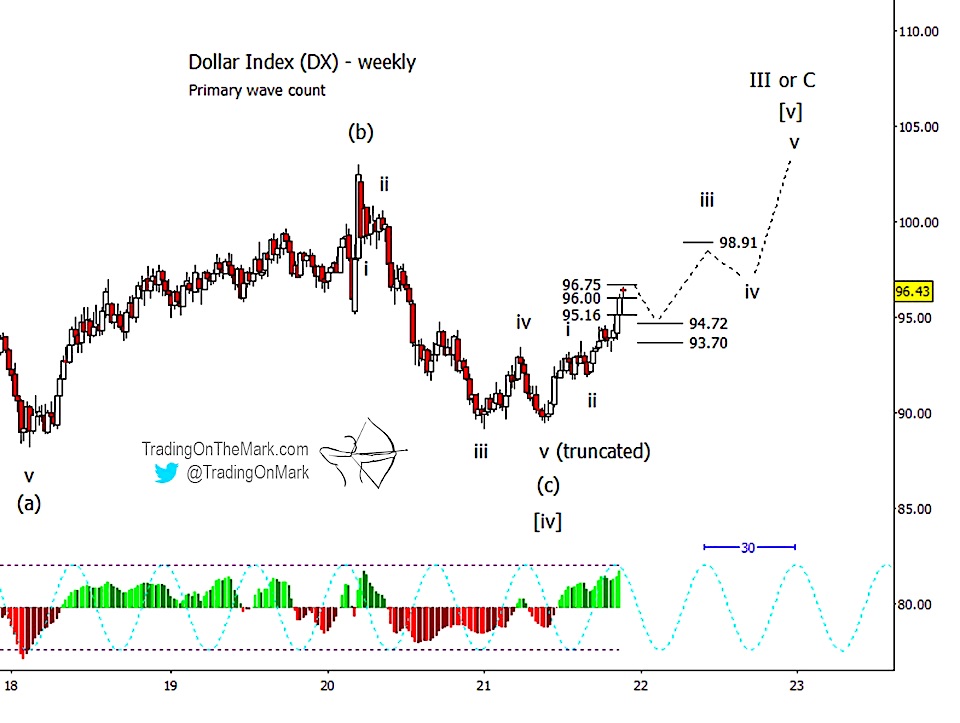
On a weekly chart, it appears that bullish enthusiasm might have resulted in a slightly truncated downward wave (c) of [iv] going into last spring. The subsequent bounce should be impulsive (consisting of five waves), and price might currently be in the middle part of that sequence. Note there is nearby resistance at 96.75. A minor correction could test 94.72 without requiring any re-labeling of the waves on the weekly chart, and there is additional support at 93.70. A preliminary target for wave ‘iii’ of [v] awaits at 98.91.
Turning back to the monthly chart, we show an even more bullish alternative wave count using green labels. In that view, the Dollar Index has already moved through big waves I, II, III and IV of a rising impulse. We have marked preliminary Fibonacci-based targets for a rising wave V at 106.97, 111.81, and 117.95. There is also potential resistance at 100.19 based on a 61.8% multiple of previous wave I.
You can get daily charts and updates for this and other highly traded markets via our subscription page on Substack and on Twitter. Take advantage of our holiday price special and save 20% on any type of subscription.
Twitter: @TradingOnMark
The authors may have a position in the mentioned securities at the time of publication. Any opinions expressed herein are solely those of the author, and do not in any way represent the views or opinions of any other person or entity.

: Showing Some Signs of Emerging Strength")

