Last Friday, Gross Domestic Product (GDP or the domestic economic growth rate) for the fourth quarter of 2017 was released. Despite being 0.3% short of expectations at 2.6% annual growth, it nonetheless produced enthusiasm as witnessed by the S&P 500 which jumped 25 points.
One of the reasons for the optimism following the release was a strong showing of the consumer which notched 2.80% growth in real personal consumption.
The consumer, representing about 70% of GDP, is the single most important factor driving economic growth and therefore we owe it to ourselves to better understand what drove that growth. This knowledge, in turn, allows us to better assess its durability.
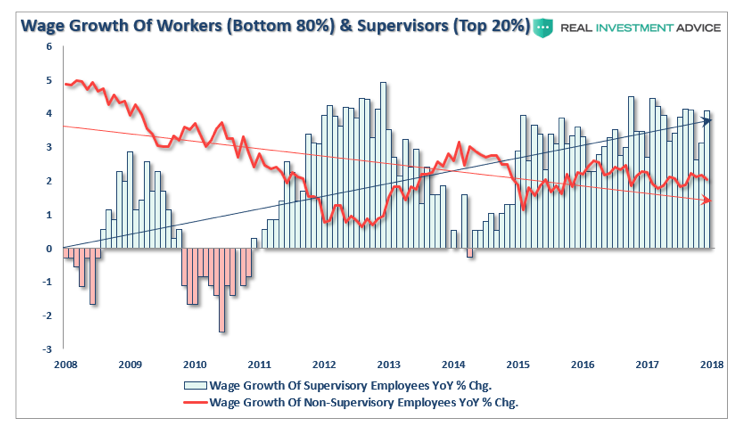
There are three core means which govern the ability of individuals to spend. The most obvious is income and wages earned. To help gauge the effect of changes in income we rely on disposable income, or the amount of money left to spend after accounting for required expenses. Real disposable personal income in the fourth quarter, the same quarter for which GDP growth data was released, grew at a 1.80% year over year rate. While other indicators of wage growth are slightly higher, we must consider that payroll gains are not evenly distributed throughout the economy. In fact as shown below 80% of workers continue to see flat to declining growth in their wages.
While this may have accounted for some of the growth in consumption we need to consider the two other means of spending over which consumers have control, savings and credit card debt.
Savings: Last month the savings rate in the United States registered one of the lowest levels ever recorded in the past 70 years. In fact, the only time it was lower was in a brief period occurring right before the 2008/09 recession. At a rate of 2.6%, consumers are spending 97.4% of disposable income. The graph below shows how this compares historically.
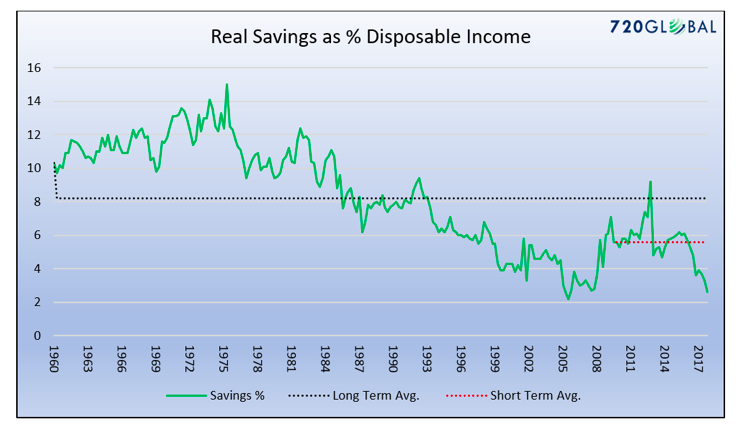
As shown above, the savings rate is less than half of that which occurred since the 2008/09 recession and well below prior periods.
There are two ways to think about the record low level of savings. Optimistically, we can claim that consumers are confident about future job prospects and wage growth and therefore feel as though they do not need to save. More realistically, we can assume that consumers are in a bind and are reducing their savings to make ends meet. More recently, the higher price of education and health coverage are likely culprits for pushing consumers to skimp on savings.
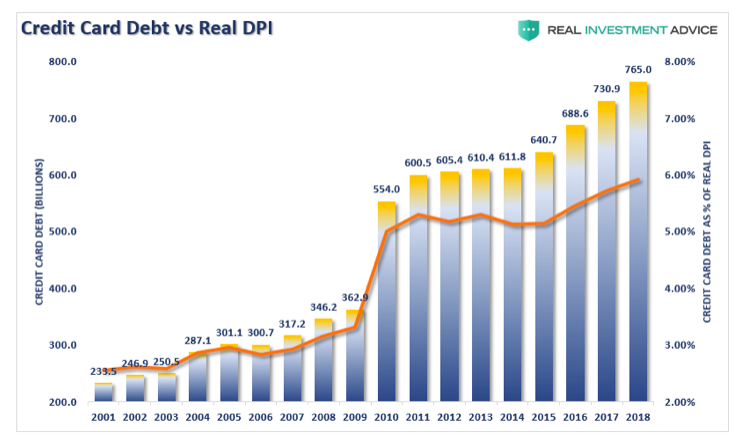
Credit Card Debt: In addition to reducing savings to meet basic needs or even splurge for extra goods, one can also use credit card debt. Confirming our suspicion about savings, a recent sharp increase in revolving credit (credit card debt) is likely another sign consumers are having trouble maintaining their standard of living. Over the last four quarters revolving credit growth has increased at just under 6% annually which is almost twice as fast as disposable income. Further, the 6% credit card growth rate is about three times faster than that of the years following the recession of 2008/09.
Adjusted GDP
While the GDP data represents actual consumption, we again ask if it is sustainable. In the case of the last few quarters, in particular, we must answer that question based on the ability for savings to decline further and credit card usage to remain high. As such, we normalized GDP based on the savings rates and credit card usage growth of the post-recession era. In our opinion, this gives us a realistic reading of what GDP would be like without the benefits of sharply reduced savings rates and unsustainable usage of credit cards.
Savings: If we recalculate the amount of consumption that would have occurred had the savings rate remained at the post-recession savings rate of 5.50%, we compute that $281 billion of savings was sacrificed over the last four quarters.
Credit Cards: The amount of revolving debt has been increasing at 6% annually over the last four quarters which is double the rate of income, or the ability to pay for the debt. If we assume instead a more normal 3% usage growth rate, which is in line with income growth, we estimate that additional credit accounted for $20 billion of spending above and beyond what is sustainable.
Over the last four quarters, real GDP rose by $421 billion, resulting in a 2.60% annual increase. If we adjust consumption to more normal levels of spending and credit usage, the increase in GDP is a mere 0.71%, hardly robust.
Summary
Can savings decline further and credit increase more? The answer is yes, but to do so savings would hit all-time lows and the rate of credit growth would greatly exceed the rate of income growth. Despite the hype of post-tax reform corporate bonuses, wages and salaries continue to muddle along at a very uninspiring rate. This data further tells the story of an indebted consumer that is being forced to spend more income on non-discretionary items such as rent, education, healthcare and energy and in response is using credit and savings to fund those purchases.
This story will get interesting when the first-quarter 2018 GDP is released and the hangover from the holiday season reveals itself. The revisions to growth are likely to be confounding and broadly rationalized away by stock-friendly analysts. While monthly data has yet to give us any meaningful indications, we suspect personal consumption for the current quarter, and likely many ahead, will be weak.
Twitter: @michaellebowitz
Any opinions expressed herein are solely those of the author, and do not in any way represent the views or opinions of any other person or entity.

: Worrisome to Broader Market?")


