When we wrote about the U.S. Dollar ETF in October, we indicated a preference for the scenario with a modest downward retrace instead of a quick upward breakout.
The retrace scenario worked, and now we can offer an updated Elliott wave forecast. We still believe the larger trend for the U.S. Dollar is upward.
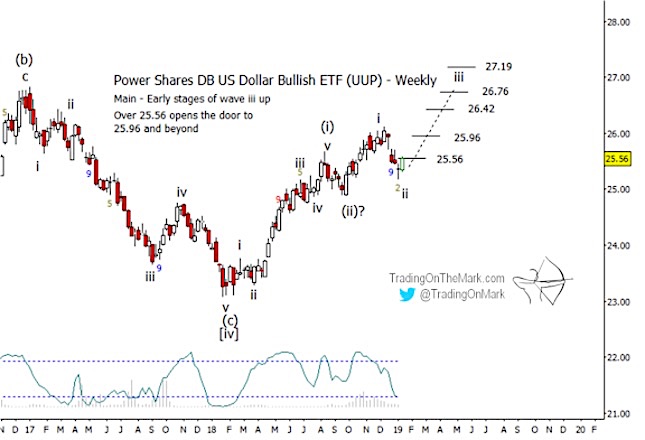
Using a weekly chart for the Power Shares DB US Dollar Bullish ETF (NYSEArca: UUP), we see it climbed modestly in the last months of 2018.
It slightly exceeded the first resistance level we had identified in our October post, but the final trading week of the year took price decisively back beneath the level.
Now that price has made a satisfactory retrace, we expect UUP to attempt to climb in fairly steady fashion through the next several months. We recently posted a monthly chart of UUP at our website showing how channel geometry is consistent with the idea of a rise from near the current area.
The first confirmation that the upward move has begun will be a weekly close above the Gann-related level at 25.56.
The internal structure of the moves in recent months has led us to revise our Elliott wave count slightly, and the revised count may actually be easier to use when trading.
Because the move up from September 20, 2018 consisted of five small waves, we are treating it as impulsive. That indicates it was not simply the middle part of a corrective consolidation as we had suggested in October.
Instead it appears to be the start of another larger upward impulse. The size of the initial subwave ‘i’ suggests the entirety of wave (iii) may be quite expansive. As an Elliottician would say, wave (iii) may be extending.
Using relationships between sub-wave ‘i’ of (iii) and the developing wave ‘iii’ of (iii), the first main resistance above the Gann level sits at 25.96, representing a Fibonacci 1 x 0.618 measurement. UUP should overcome that resistance fairly easily, but there may be an opportunity for a trade if price shoots through the level and then tests it again as support.
Beyond that, the next set of resistance levels at 26.42, 26.76, and 27.19 should be thought of as targets for subwave ‘iii’ of (iii), with those levels representing the Fibonacci measurements 1 x 1, 1 x 1.272, and 1 x 1.618 respectively.
Follow Trading On The Mark on Twitter for more frequent updates about ETFs and futures!
Twitter: @TradingOnMark
The authors may have a position in the mentioned securities at the time of publication. Any opinions expressed herein are solely those of the author, and do not in any way represent the views or opinions of any other person or entity.


: Showing Some Signs of Emerging Strength")
