Three months ago we posted a chart at See It Market showing how the U.S. Dollar ETF (NYSEARCA:UUP) had reached an important resistance area per our Elliott wave and technical analysis.
We suggested that traders operating on medium time frames might use that as a signal to adjust their positions in currency trades.
Since that time, the Power Shares DB U.S. Dollar Bullish ETF retreated from the initial resistance area before rallying again to test the next level. Today we’ll provide an update on the US Dollar Elliott wave roadmap.
Longtime readers know we view the Dollar and UUP as still being in an upward trend, and within that framework the consolidation of recent months probably fits as wave (ii) of the expected (i)-(ii)-(iii)-(iv)-(v) sequence.
The traders task is then to decide whether wave (ii) is complete. Will UUP break upward in a powerful wave (iii), or does there need to be one more downward leg of (ii) to test supports?
The bullish first option probably would manifest with a relatively swift break of Gann resistance at 25.87, followed by tests of other levels in the Gann ladder at 26.19 and 26.51.
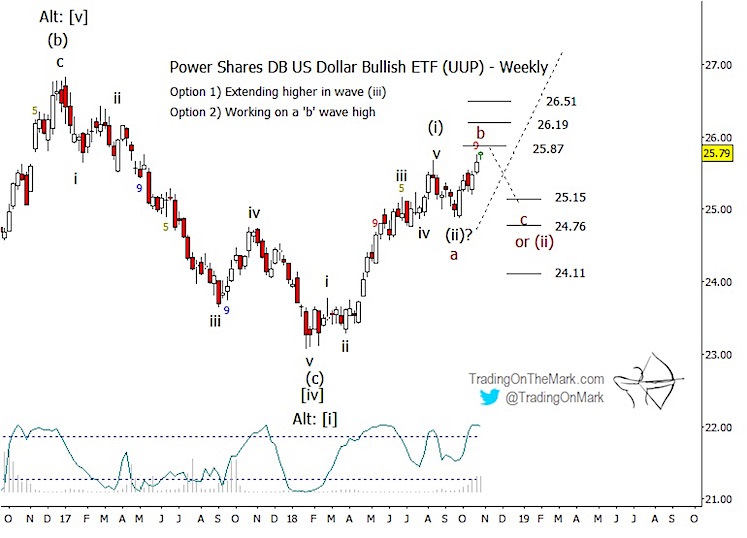
The near-term bearish second option treats the current UUP high as the middle wave ‘b’ of the ongoing wave (ii) correction, to be followed by downward wave ‘c’ of (ii). If UUP makes a retreat from nearby resistance during the next few weeks, that could signal countertrend traders to look for a test of one or more of the standard Fibonacci retracement levels at 25.15, 24.76 and 24.11.
Because big changes in currency trends often happen around the turn of the year, we have a slight preference for a continued wave (ii) consolidation during the next few months. That would be a setup for a wave (iii) rally to form from lower than the current price.
If the early part of 2019 brings a new upward trend from one of the support levels, it would be reasonable to expect that trend to continue until the next inflection of the 83-week cycle in the Dollar Index in mid-summer 2019.
Since there has been a good response to our October membership offer, we’re going to keep the window open for a few more days – until Sunday, November 4. New subscribers can lock in savings of 15% on all of our services using coupon code “fractal”.
Trading On The Mark gives subscribers twice-daily charts and analysis for the Dollar Index, Euro futures, the S&P 500, crude oil, treasury bonds, and gold.
Twitter: @TradingOnMark
The authors may have a position in the mentioned securities at the time of publication. Any opinions expressed herein are solely those of the author, and do not in any way represent the views or opinions of any other person or entity.

: Showing Some Signs of Emerging Strength")
