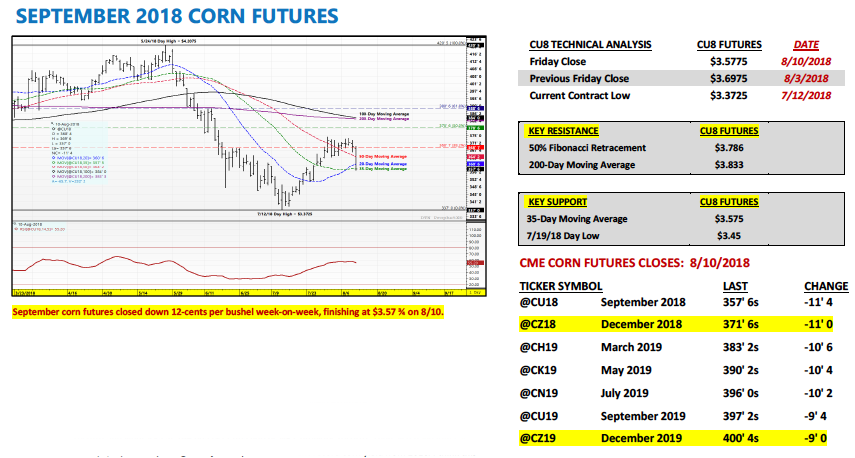
SEPTEMBER corn futures closed down 12-CENTS per bushel week-on-week, finishing at $3.57 ¾.
Let’s review current themes, data and trends for the week ahead (week of August 13):
Monday’s Weekly Crop Progress report showed the U.S. corn good-to-excellent rating slipping 1% week-on-week to 71% versus 60% in 2017.
Iowa and Minnesota saw their good-to-excellent ratings fall 3% and 2% respectively. Nebraska’s rating also leaked 1% to 85% good-to-excellent. That said of the top 6 corn producing states in the country, not one is currently rated less than 70% good-to-excellent. Therefore it’s hard to argue against the U.S. potentially having another record corn yield in 2018/19.
As of August 5th…Iowa was rated 75% good-to-excellent, Illinois 81%, Nebraska 85%, Minnesota 77%, Indiana 71%, and South Dakota 70%. Those 6 states account for between 66 to 68% of the total U.S. corn crop. At present only Minnesota has a good-to-excellent rating less than a year ago.
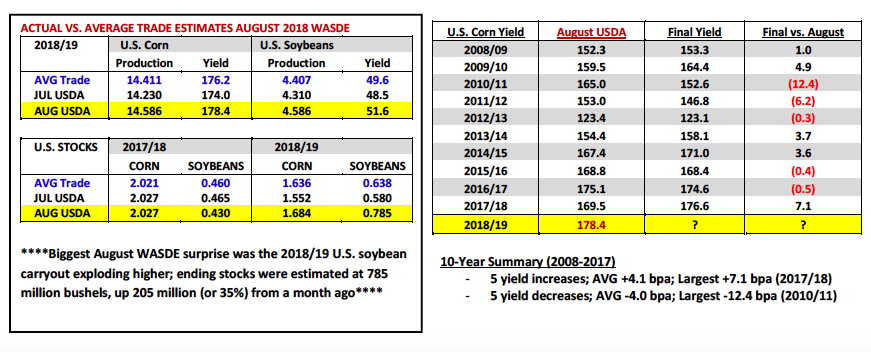
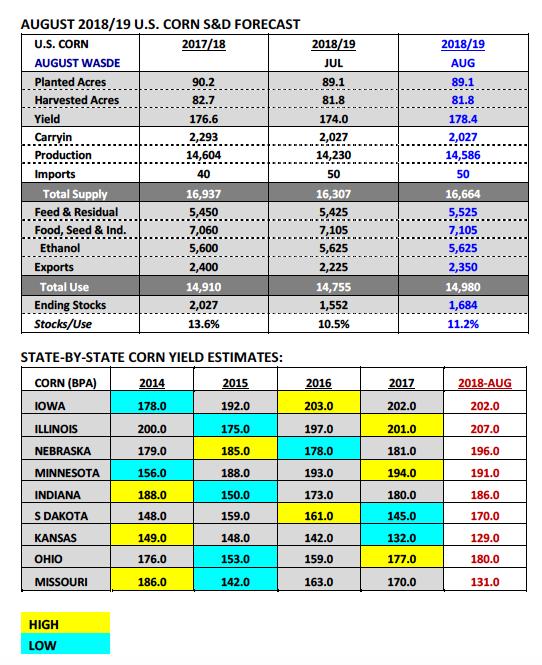
On Friday the USDA released its much anticipated August 2018 WASDE report. In that report the USDA increased the 2018/19 U.S. corn yield to 178.4 bpa, up 4.4 bpa versus July and 2.2 bpa higher than the average trade guess.
If realized in January the USDA’s revised U.S corn yield forecast would represent a new record high, exceeding the previous high-water mark of 176.6 bpa established just one year ago in 2017/18. Total 2018/19 U.S. corn production improved to 14.586 billion bushels versus 14.230 billion in July and the average trade guess of 14.411 billion bushels.
On the demand side of the U.S. corn balance sheet the USDA did raise Feed and Residual use 100 million bushels to 5.525 billion while also increasing Exports 125 million bushels to 2.350 billion.
The combined demand increases of 225 million bushels helped neutralize what was a supply side increase of 357 million bushels versus a month ago. 2018/19 U.S. corn ending stocks improved to 1.684 billion bushels, 48 million bushels higher than the average trade guess. That said current U.S. corn ending stocks are down 343 million bushels (or 17%) from last year.
The headline grabber from the report however came in the soy complex.
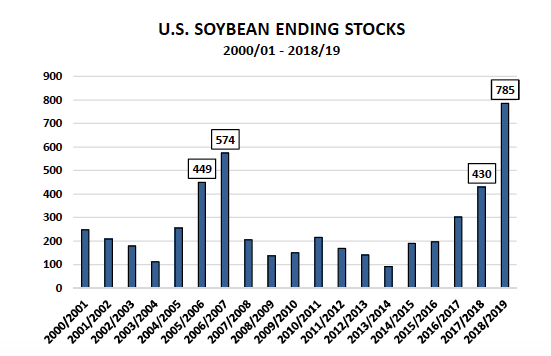
The USDA raised the 2018/19 U.S. soybean yield to 51.6 bpa, up 3.1 bpa from July and 2.0 bpa above the average trade guess. 2018/19 U.S. soybean production surged to a new record high of 4.586 billion bushels, an increase of 276 million bushels month-on-month. The end result was 2018/19 U.S. soybean ending stocks of 785 million bushels, a would-be record by 211 million bushels or nearly 27%.
The immediate market impact of the USDA’s massive upward stocks revision in soybeans was fairly predictable with November soybeans futures off nearly 40-cents per bushel as of the noon hour CST (trading at approximately $8.66 per bushel).
September Corn Futures Outlook
Corn futures found themselves once again caught in the backdraft of a massive sell-off in soybean futures Friday afternoon. Had the corn market been able to stand solely on the adjustments made to the U.S. corn S&D in the August WASDE report, I believe September corn futures would have closed higher on Friday. The reasons why are as follows:
1. The USDA’s revised U.S. corn yield projection of 178.4 bpa is anything but conservative.
In August 2017, the USDA projected a very “safe” U.S. corn yield estimate of 169.5 bpa, which over time eventually improved to 176.6 bpa. This year the USDA’s already all-in on this being a record breaker, forecasting record state corn yields for Illinois of 207 bpa (+6 bpa versus IL’s previous record) and Nebraska at 196 bpa (+11 bpa versus NE’s previous record). They also have Iowa at 202 bpa, equal to a year ago and just 1 bpa off its current record corn yield from 2016. I think this year’s crops in all 3 aforementioned states are good but not necessarily head and shoulders above 2017. Therefore this could be a year where the U.S. corn yield drifts marginally lower in the September and October WASDE reports.
2. U.S. corn export business is booming. In the August report the USDA increased 2018/19 U.S. corn exports 125 million bushels to 2.350 billion…I think that number could go up even higher in future Crop reports. With Brazil’s 2017/18 corn crop off 16% year-on-year, they won’t have the ability to refill their corn export pipeline until next May/Jun/Jul, which coincides with Brazil’s 2019 safrinha corn harvest. That said U.S. corn exports should remain strong for the foreseeable future.
The biggest problem for Corn Bulls remains soybeans.
The USDA’s 2018/19 U.S. soybean ending stocks estimate of 785 million bushels is insanely negative if taken at face value. That said will the market actually trade that number or will traders assume that U.S. soybean exports will eventually pop back up 200 to 250 million bushels once the tariff war ends with China? If that happens then the real ending stocks figure in soybeans is much closer to 550 million bushels. That’s not Bullish but it’s also not sub-$8.50 November soybean futures Bearish. If soybean prices can just stabilize….corn futures might have a chance to rally 20-cents from current levels.
Twitter: @MarcusLudtke
Author hedges corn futures and may have a position at the time of publication. Any opinions expressed herein are solely those of the author, and do not in any way represent the views or opinions of any other person or entity.
Data References:
- USDA United States Department of Ag
- EIA Energy Information Association
- NASS National Agricultural Statistics Service

: Worrisome to Broader Market?")


