In our April post about the British Pound, we suggested that it should climb a bit higher to test an important resistance zone before resuming its larger downward trend. Now the Pound is in the zone, and we are watching for signs of a reversal.
In April we used a monthly chart of the CurrencyShares British Pound Sterling Trust (NYSEARCA:FXB) to diagram an expected Elliott wave five-wave move down from the Pound’s mid-2014 high. We showed how Fibonacci resistance, channel geometry and cycle timing might coincide to mark the beginning of the fifth and final downward wave.
Now that the British Pound and its ETF (FXB) is in the right area of price and time, we turn to the weekly chart below to show more detail about that area. First we note that price has recognized the boundaries and harmonics of a modified Schiff channel numerous times during its cascade through the steps of an impulsive pattern. The rally in recent months has brought the British Pound back into contact with the main lower boundary of the channel, which also coincides with the Fibonacci 23.6% retracement of wave [iii].
We also note that the recent rally, which we are treating as a fourth wave, has reached the price level of the prior fourth wave of lesser degree. This is an Elliott wave rule of thumb that helps predict the region where a fourth wave may end. In this case, wave [iv] of the larger impulse is testing the vicinity of the smaller sub-wave (iv) that was internal to wave [iii].
British Pound “Weekly” Bars Elliott Wave Chart
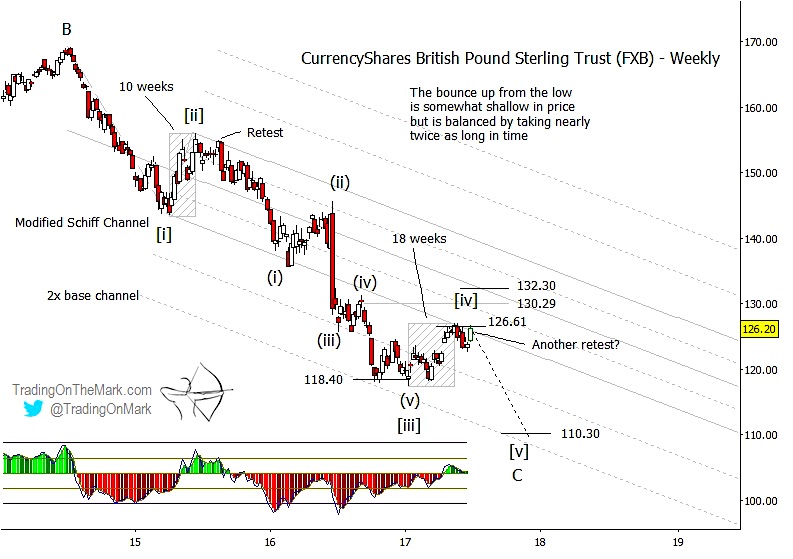
A retracement of 23.6%, which FXB is currently testing, represents a relatively shallow retracement on the British Pound Elliott wave chart. In other circumstances we would be more interested in the 38.2% level for a fourth wave to test. However, the developing wave [iv] on the chart has persisted in its sideways/upward drift for a relatively long time compared to the corresponding wave [ii]. In a corrective wave, and especially with fourth waves, horizontal distance on the chart (time elapsed) can sometimes substitute for vertical distance (price change) of the retracement.
If FXB breaks above the channel boundary and the 23.6% Fibonacci retracement, then the next area to watch probably will be the 38.2% retracement level near 132.30. Depending on time, there could also be channel resistance in that area too. As we noted earlier though, the amount of time that wave [iv] has already taken, along with an analysis of price cycles, suggests that the British Pound may not need to reach higher than the current area before reversing.
We don’t expect this to be a sleepy summer for Traders! Keep up with the turns and the trades by following us on Twitter @TradingOnMark and on facebook. Thanks for reading.
No position in any of the mentioned securities at the time of publication. Any opinions expressed herein are solely those of the author, and do not in any way represent the views or opinions of any other person or entity.


