The FOMC minutes release comes today at 2pm, and it is clear the markets are waiting for the data. Stock market futures have been quite range bound, with mixed momentum. So perhaps this news will be a catalyst to get prices going.
Support for S&P 500 futures resides between 2030.5 and 2034.5, and below that we have the 2022.5-2027 levels. Resistance sits between 2061.5 and 2056. If buyers catch a bid up there, we could see new upward action into 2071-2075, but charts still feel heavy to me.
Momentum on the four hour chart is still neutral to bearish; we are sitting at important support and congestion so buyers should come back into the game near support levels- just as they did yesterday. Their show of force will be assessed as sellers intent on moving the markets down grow increasingly anxious here as S&P 500 futures hold support. Quite an interesting battle to observe. Participation for me has been smaller sized due to the environment.
Shorter time frame momentum indicators are positive, but flattening at congestion here. We have a range that runs from 2038-2046 with buyers and sellers defending their regions fiercely at this writing.
See today’s economic calendar with a rundown of releases.
THE RANGE OF THURSDAY’S MOTION
Crude Oil Futures (CL_F)
The April 6 outlook for crude oil futures will be affected by the EIA report this morning and OPEC meeting ahead. A support bounce yesterday is holding in a sharp move upward. I suspect this has to do with the idea that the meeting will deliver information that suggests the curtailing of production (with prices bouncing, why would you want to do that???)- a classic case of the tail wagging the dog here. But can’t get bogged down in that thinking, or the trades get muddy. Just read the chart, and follow the moves- that’s my simple strategy.
Today, the trading ranges for crude oil are between 35.78 and 38.54.
Moving averages in oil are mixed on tighter time frames, but we are bouncing off a support level of importance near 35.3 from yesterday. Resistance is between 38.2 and 37.9; support is likely near 36.2 and 35.7.
Intraday long trading setups on crude oil futures suggest a long off a 37.3 positive retest (check momentum here), or 36.65 positive retest on the pullback into targets of 36.89, 37.24, 37.42, 37.7, and if buyers hold on, we’ll see 38.31.
Intraday short trading setups (quite countertrend at this time) suggest a short below a 36.45 failed retest, or the failed retest of 37.04 (with negative momentum prevailing) sends us back through targets at 36.16, 35.89, 35.76, 35.45, 35.14, and 34.89 to 34.7, if sellers hang on.
Have a look at the Fibonacci levels marked in the blog for more targets.
E-mini S&P 500 Futures (ES_F)
Below is a S&P 500 futures chart with price support and resistance trading levels for today. Click to enlarge.
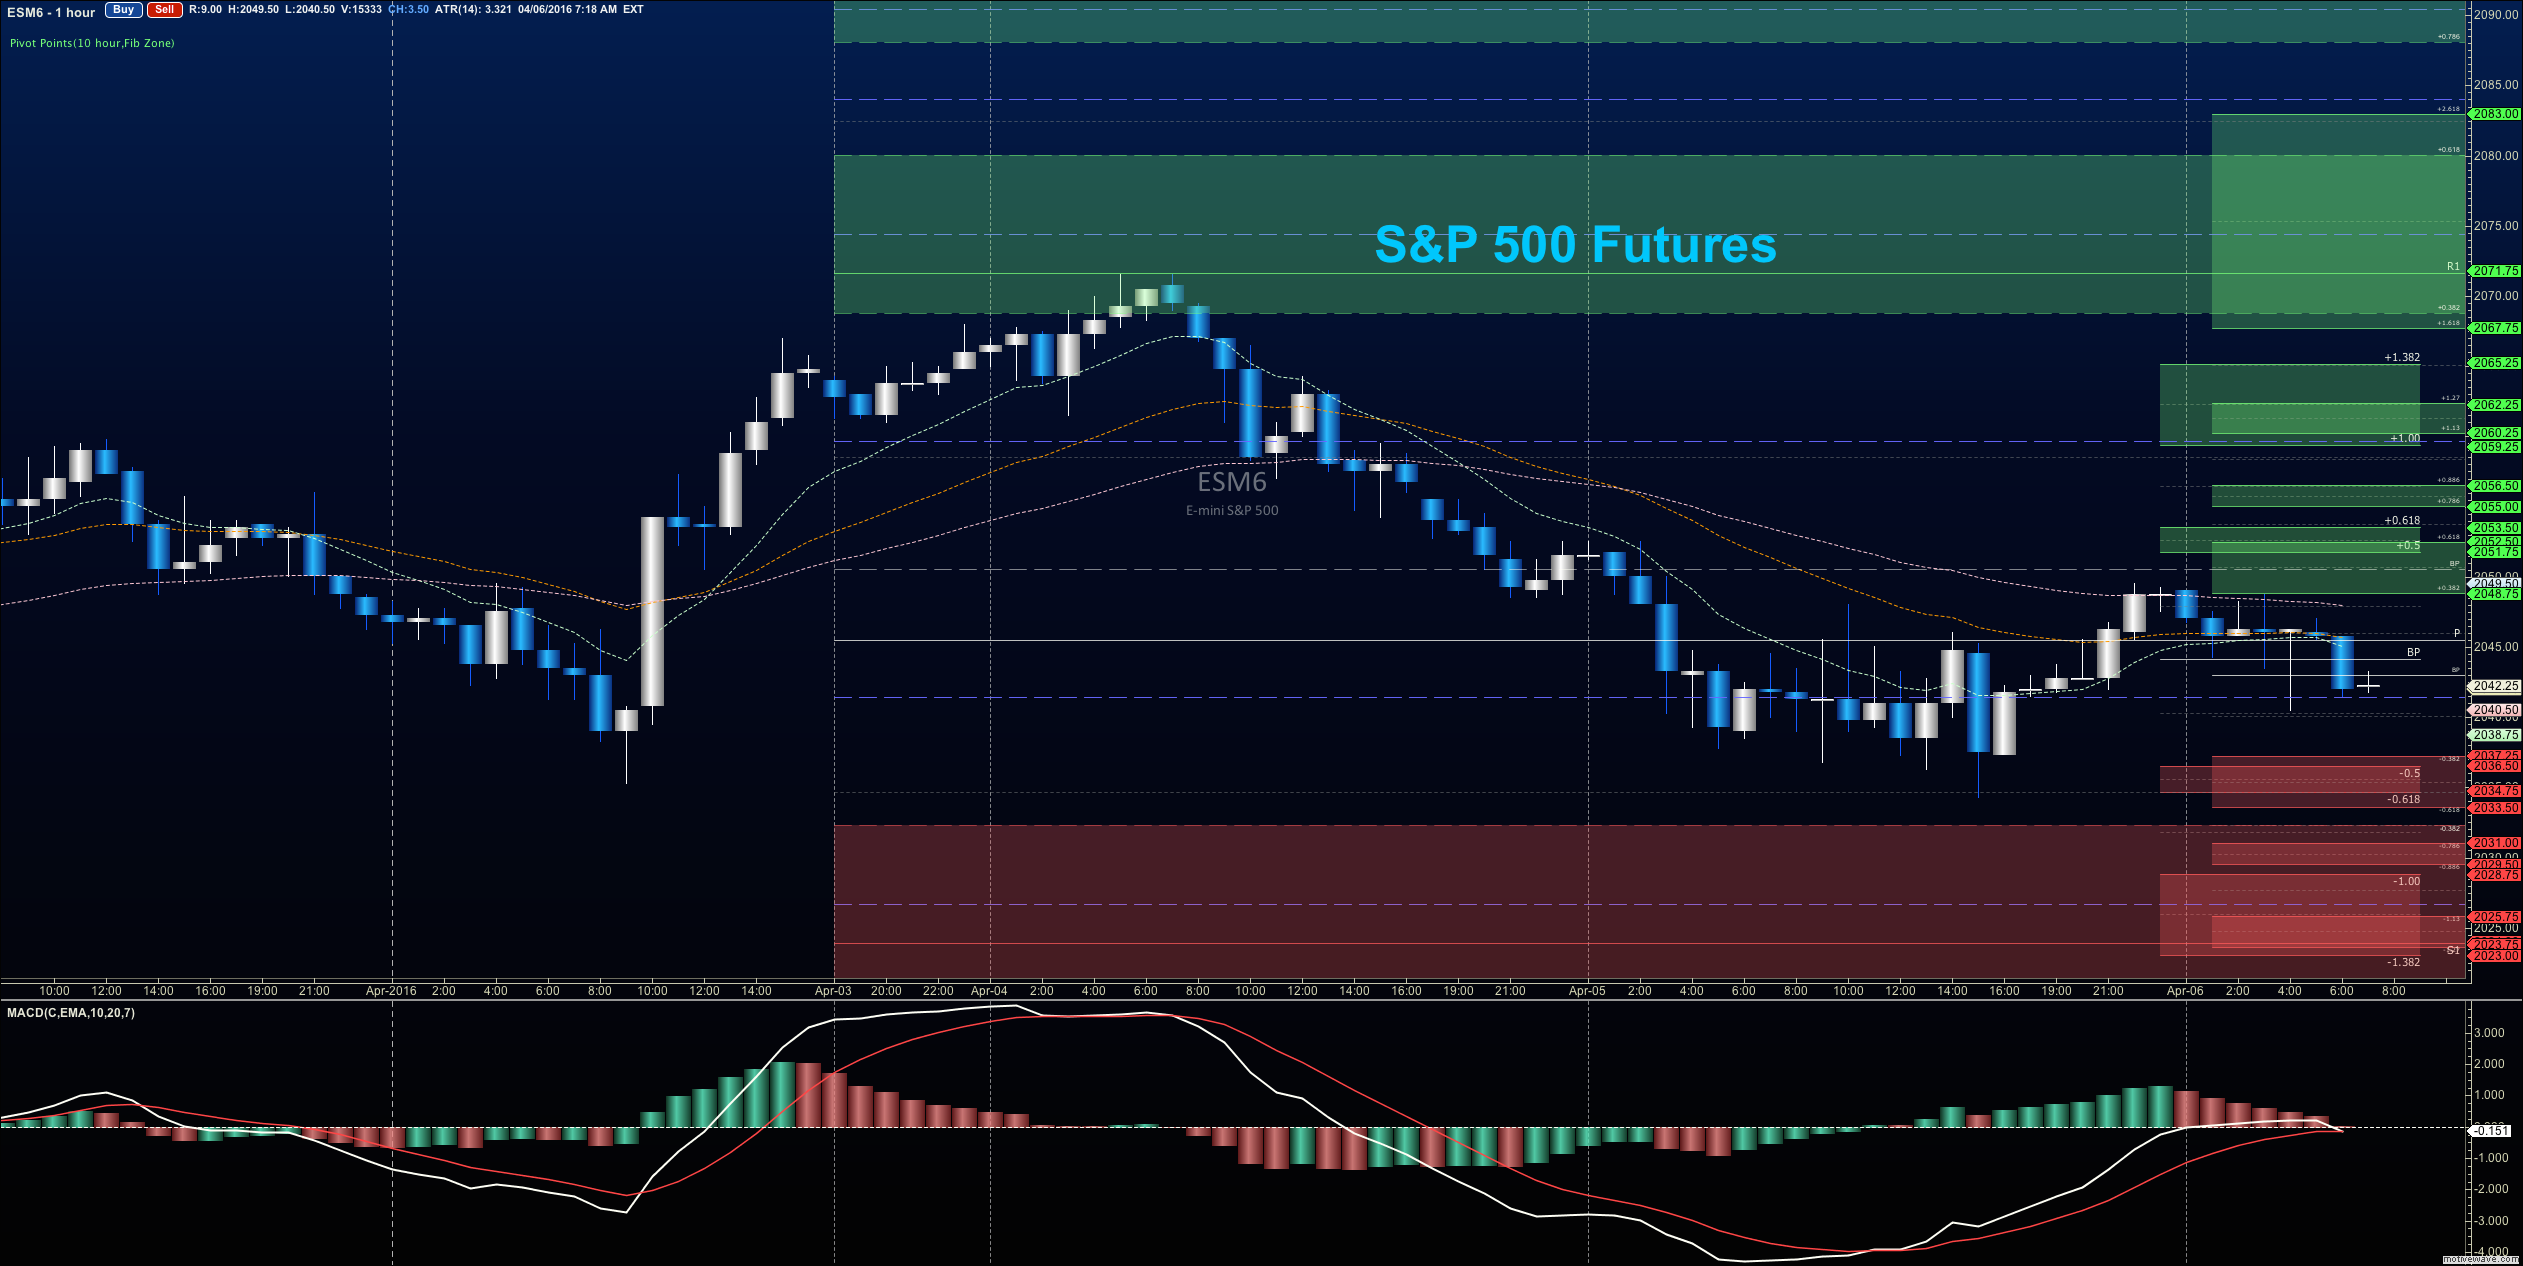
Looking at the S&P 500 futures chart for April 6, the levels between 2056.5- 2061.75 currently serve as front line resistance, while support remains the 2030.5- 2036.5 region. Expansions outside these ranges should retest nearby before continuation.
Upside motion has the best setup on the positive retest of 2039 or a breach and retest of 2047.5 with positive momentum. I use the 30min to 1hr chart for the breach and retest mechanic. Targets from 2042.5 are 2044.5, 2047.5, 2049.75, 2051.25, 2054.5, 2057.5, and if we can catch a bid there, we could expand into 2061.5, 2064.25, and 2067.5. Long action is still trending over the bigger picture for now, but momentum is now drifting.
Downside motion opens below the failed retest of 2037 or at the failed retest of 2052.5 with negative divergence (careful here- watch for the higher low to develop to tell you that an early exit might be necessary). Retracement into lower levels from 2052.5 gives us the targets 2049.5, 2047.75, 2044.75, 2040.50, 2037.75, 2035.75, 2032.75, 2029.5, and perhaps 2025.5 to 2022.5, if selling really takes hold.
If you’re interested in the live trading room, it is now primarily stock market futures content, though we do track heavily traded stocks and their likely daily trajectories as well – we begin at 9am with a morning report and likely chart movements along with trade setups for the day.
As long as traders remain aware of support and resistance levels, risk can be very adequately managed to play in either direction as bottom picking remains a behavior pattern that is developing with value buyers and speculative traders.
Thanks for reading.
Twitter: @AnneMarieTrades
The author trades stock market futures every day and may have a position in mentioned securities at the time of publication. Any opinions expressed herein are solely those of the author, and do not in any way represent the views or opinions of any other person or entity.

: Worrisome to Broader Market?")


