S&P 500 Weekly Outlook & Technical Market Review – September 23
Here’s a look at some key stock market indicators and emerging themes that we are watching in our latest “Stock Market Outlook”:
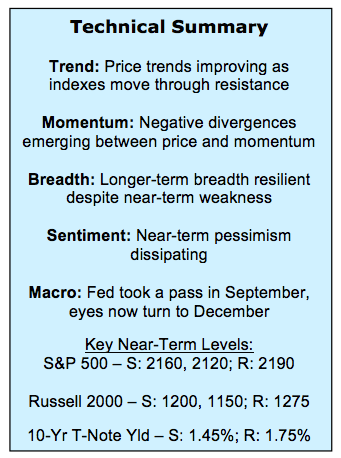
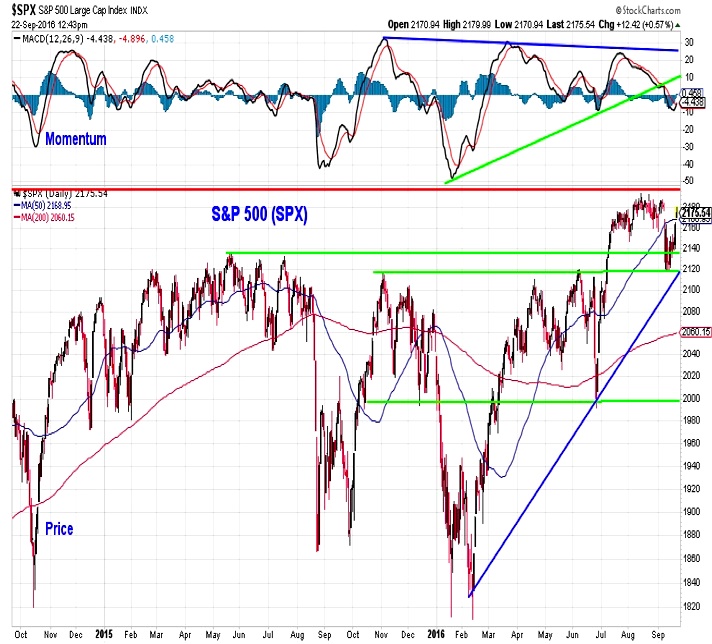
Rally Off of Lows Comes with Divergences – From a price perspective, stocks appear to be getting back in gear. The S&P 500 Index (INDEXSP:.INX) has held support (near 2120) and broken above resistance (near 2160), while the Nasdaq Composite (INDEXNASDAQ:.IXIC) has broken out to a new all-time high. Momentum trends have not confirmed this more favorable price action.
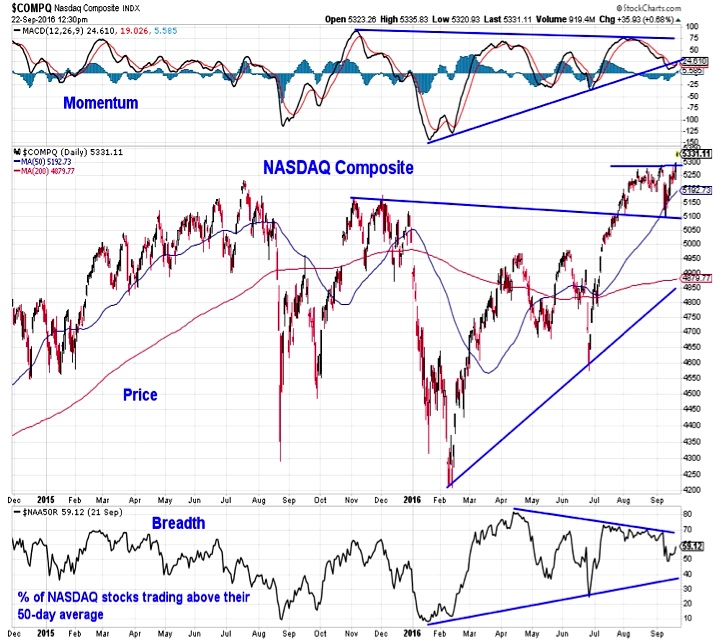
Short-Term Breadth Trends Continue to Argue for Caution – Echoing the momentum divergences, short-term market breadth remains a headwind for the popular averages. The trend in the number of stocks making new highs has moved lower and despite the record high on the NASDAQ, more than 40% of the stocks there are trading below their 50-day averages.
Sentiment Trends Not Showing Persistent Pessimism – While some hints of pessimism have been seen, there is evidence that even that is waning. The NDR Trading Sentiment Composite is on the cusp of returning to neutral (from excessive pessimism) and the VIX Volatility Index (INDEXCBOE:VIX) has collapsed below 12. Longer-term measures of sentiment show optimism is waning but excessive pessimism is generally lacking.
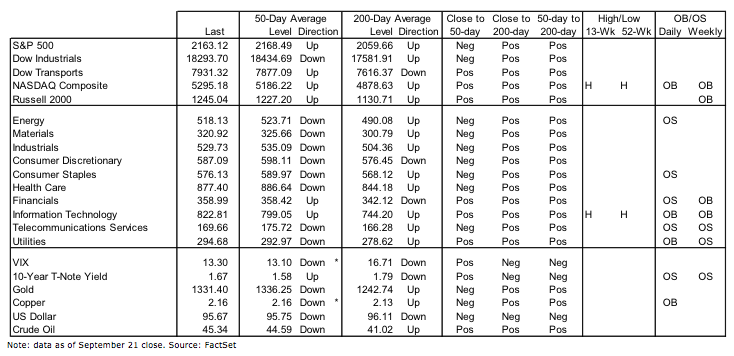
Stock Market Indicators – S&P 500 Weekly Outlook (click to enlarge)
After testing and holding support near 2120 and then 2140, the S&P 500 has rallied back into the range that persisted for much of July and August. While encouraging from a price perspective, confirmation remains lacking from a momentum perspective. Rather the momentum up-trend that emerged off of the early-2016 lows has not held and momentum has moved lower over the past two months as price has moved sideways. Price trumps momentum, but when breadth is added to the picture (it is currently siding with momentum) it argues for maintaining a cautious outlook for now.
The NASDAQ Composite has not just moved back into a trading range, it has moved to a new all-time high. Momentum, however, has not confirmed the new price high, the breadth has deteriorated as the index has moved higher. In April, when the NASDAQ Composite was still shy of 5000, 80% of its stocks were trading above their 50-day averages. In July, with the composite moving above 5100, 70% of the stocks were above their 50-day averages. Now, with the index moving above 5300, fewer than 60% of the stocks are trading above their 50-day averages. Rather than drawing in laggards, the rally in the NASDAQ has become more narrowly focused.
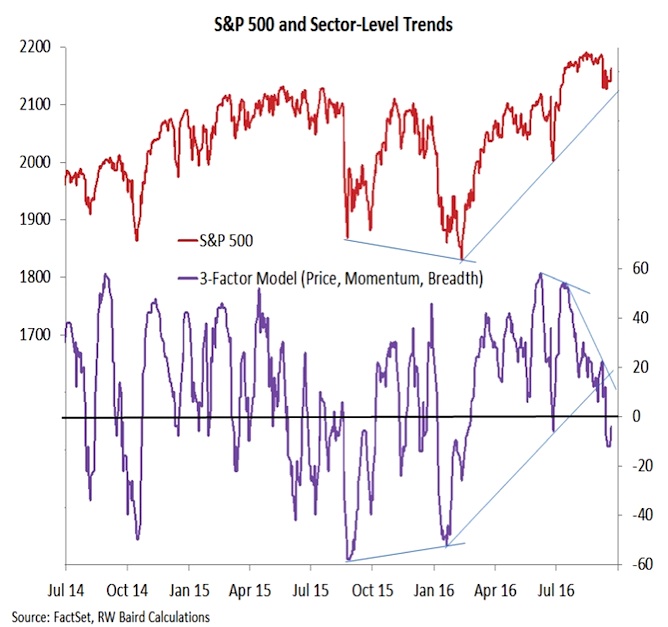
We have yet to see meaningful improvement in our sector-level trend indicator. When looking at price, momentum and breadth trends across the S&P sectors (we still use just ten for this indicator, not yet spinning Real Estate out of the Financials sector), the sector-level situation is not as robust as the price action on the S&P 500. When a meaningful low is in place, we would expect confirmation from this indicator. For now, it continues to diverge from the S&P 500 and argues for caution.
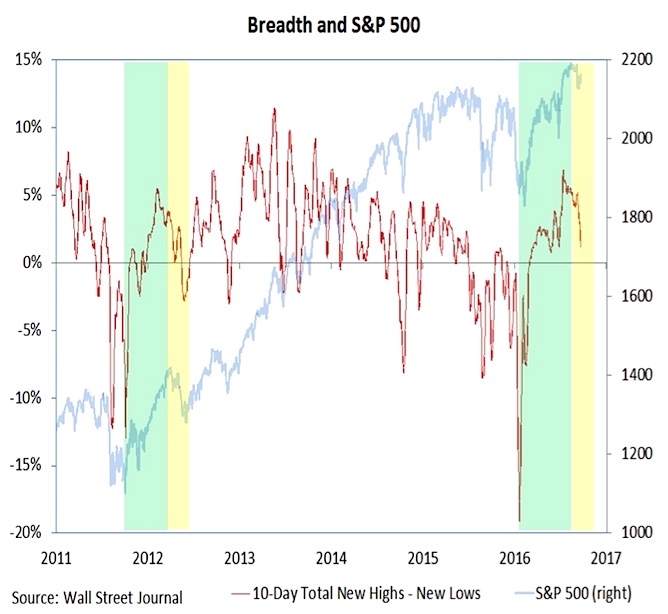
The surge in the 10-day total of net new highs (new highs less new lows) earlier this year was a strong indication that the bounce off of the February lows was meaningful and had staying power. That signal is undiminished. However, after moving to a new multi-year high, this indicator has steadily deteriorated and does not offer evidence that a sustainable leg higher for the S&P 500 is imminent. So far the pattern seems similar to the early-2012 experience. If this holds, we could see some near-term stabilization in the number of new highs, followed by further weakness later this fall.
continue reading on the next page…

: Showing Some Signs of Emerging Strength")
