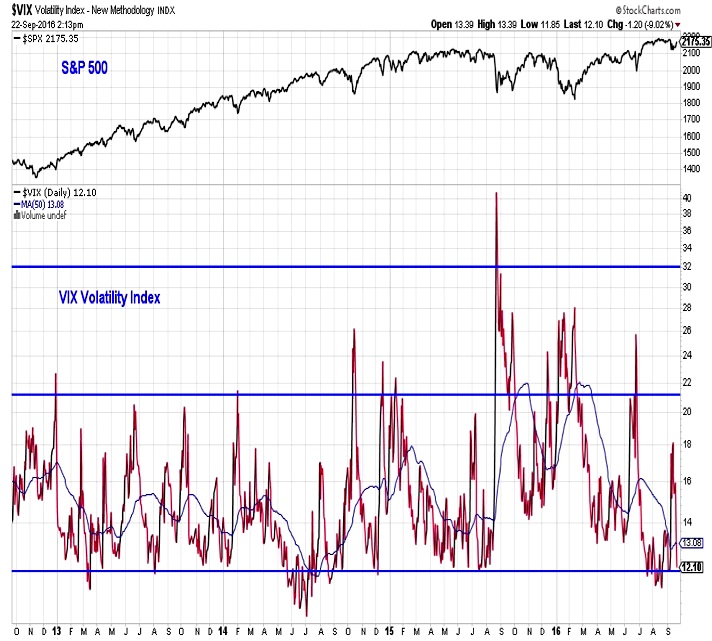
The hints of pessimism and fear that were seen two weeks ago have already begun to diminish. Following a huge one-day surge in the VIX (from 12.5 to 17.5 on 9/9), fear has evaporated and we have seen the VIX drop back below 12.
The NDR trading sentiment composite did move (barely) into the excessive pessimism zone, but is already on the cusp of moving back to neutral.
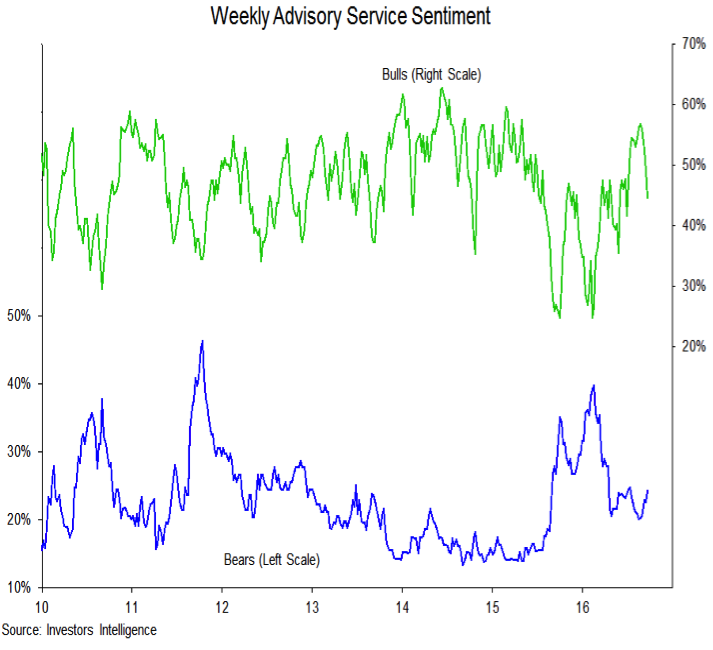
Longer-term measures of investor sentiment have shown waning optimism, but there has hardly been evidence of excessive pessimism. The NAAIM exposure index had dropped from 90% to 69%, but this week moved back up to 79%. Half of the respondents reported equity exposure between 69% and 100%, hardly evidence of pessimism. Bulls on the Investors Intelligence survey have retreated from 57% to 45%, but bears have only risen slightly (from 20% to 24%). The bull-bear spread remains above 20%, an improvement over what was seen in August, but not yet to 10% or so level that could signal washed out optimism.
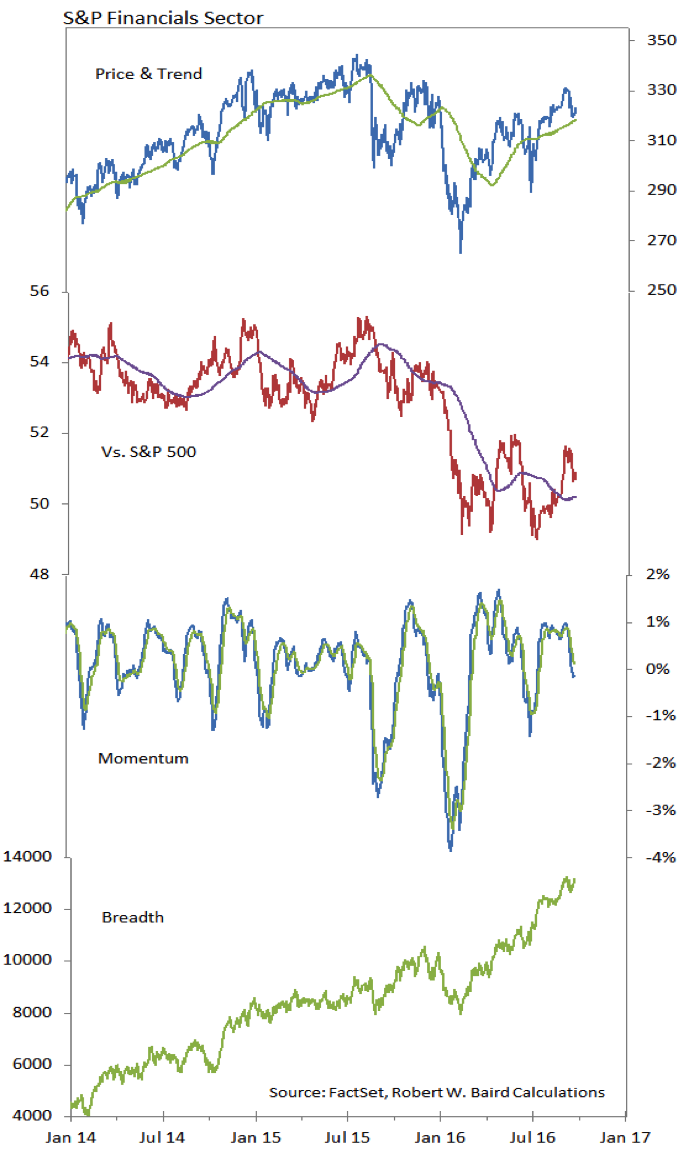
The Financials sector has climbed into the leadership group in our relative strength work. Most encouragingly, the relative price line has broken above down-trend resistance and is now testing that same line as a support level. If that holds, Financials could see continued relative strength and further improvement in the absolute price trend. Sector-level breadth remains strong.
Thanks for reading.
Twitter: @WillieDelwiche
Any opinions expressed herein are solely those of the author, and do not in any way represent the views or opinions of any other person or entity.


 May Tip Stock Market’s Next Move")


