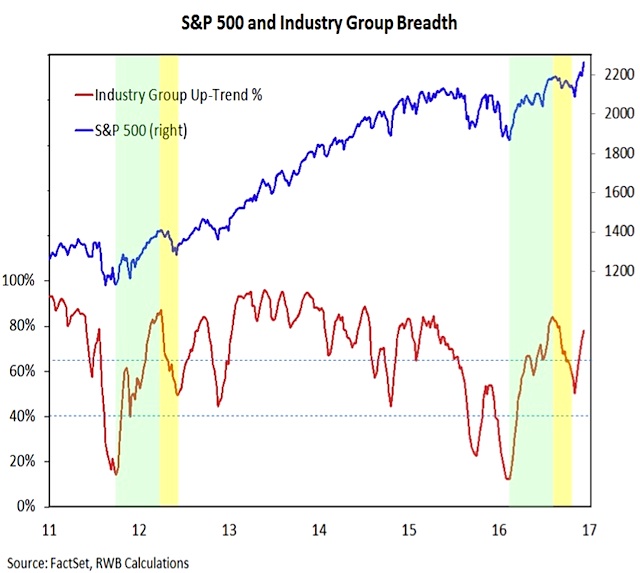
While investors have gotten somewhat carried away from a sentiment perspective, the market has helped validate some of that optimism.
An increasing percentage of industry groups (now up to nearly 80%) are in up-trends, and we have witnessed a metaphorical explosion of individual issues making new highs (and perhaps even more importantly right here, the number of issues making new lows has ebbed). The broad market is getting back in gear and looks to be a tailwind in 2017.
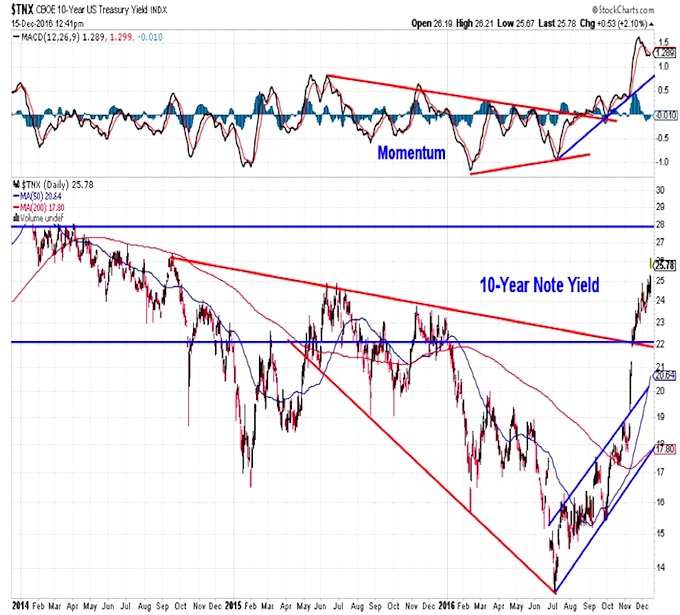
The move higher in bond yields has continued with little interruption. While the move off of the mid-year lows looks exaggerated, the 10-year Treasury Note Yield (INDEXCBOE:TNX) has only recently moved back into the range that persisted for much of 2014. While yields could continue to drift higher over the course of 2017, we could first be due for some consolidation. Yield support is near 2.2% and resistance is near 2.8%.
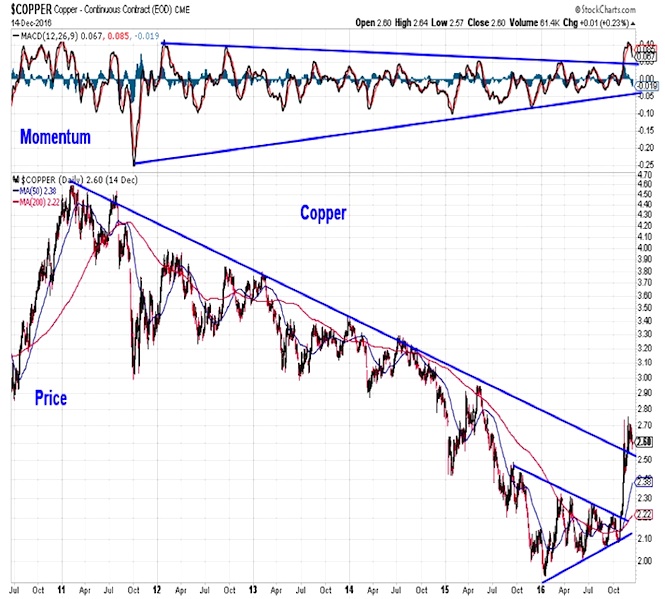
The chart of copper is among those that suggest 2016 could go down as a year of significant trend changes. The rally in copper that has been seen in the fourth quarter began as a move through the near-term down-trend resistance line (after holding support at the trend line that emerged off of the January low). As can be the case, a near-term shift in trend morphed into a longer-term shift, and now copper has broken above a down-trend that reliably served as resistance going back to early 2011. Not all short-term moves turn out to have longer-term significance, but every move of longer-term significance begins with a change in the shorter-term pattern.
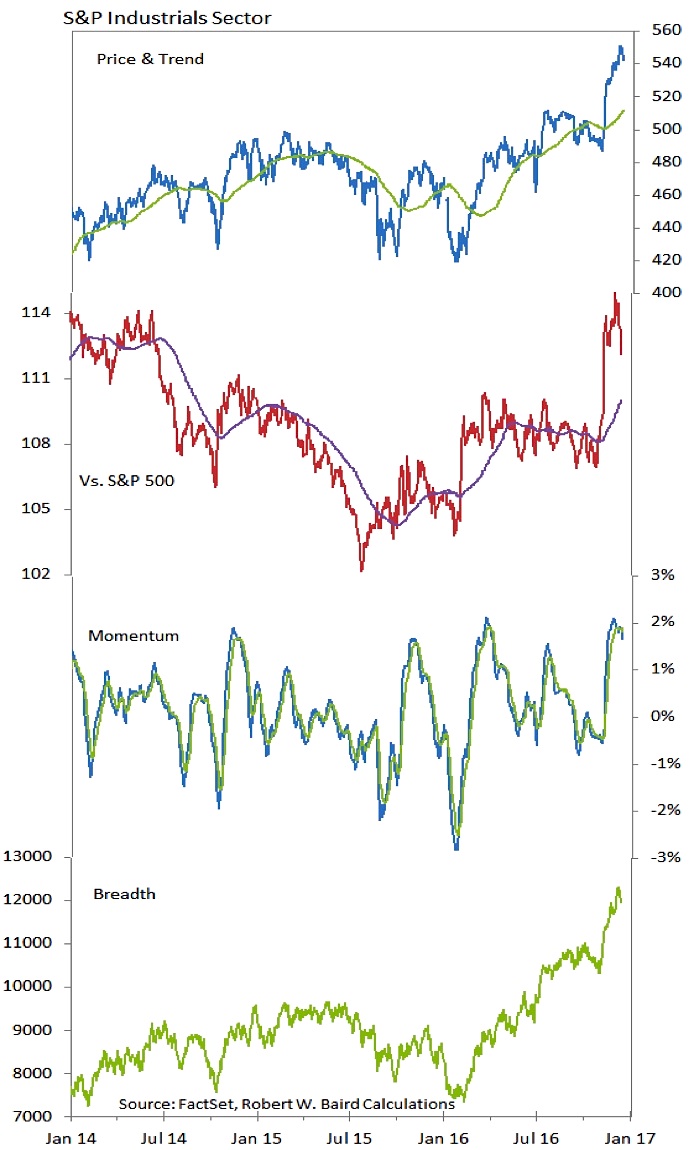
The Industrials sector (NYSEARCA:XLI) has gotten a lot of attention in the wake of the Presidential election and the hope of improved business investment environment in 2017, but this builds on strength that has emerged over the past 18 months in the sector. On a relative basis, the Industrials sector bottomed in mid-2015, and by January a higher low had been made. Momentum has broken out and sector-level breadth has been strong all of 2016. In other words, while the rally over the past month may have gotten ahead of itself, the seeds of strength have been sown for some time.
Thanks for reading.
Twitter: @WillieDelwiche
Any opinions expressed herein are solely those of the author, and do not in any way represent the views or opinions of any other person or entity.


")


 Rolling Over At Key Fibonacci Level?")
