Weekly Stock Market Outlook & Technical Review December 16th
In this research report, we’ll look at some key stock market indicators, the health of the S&P 500 Index (INDEXSP:.INX), and a handful of emerging themes that we are watching in our research:
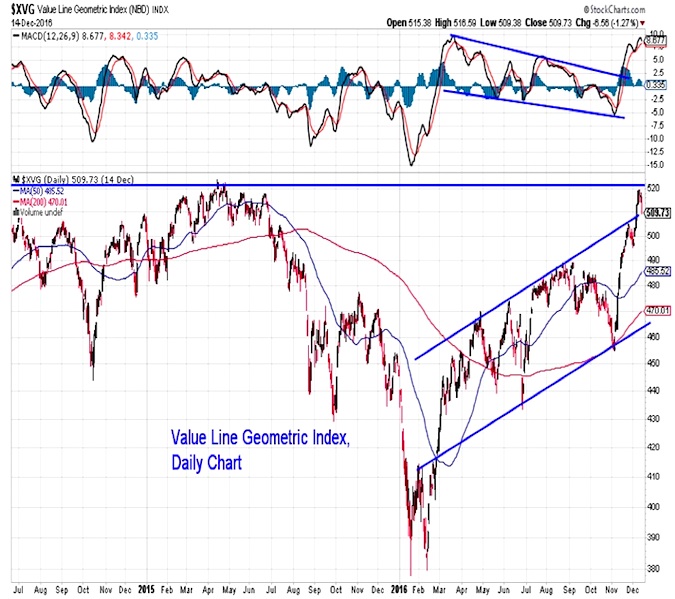
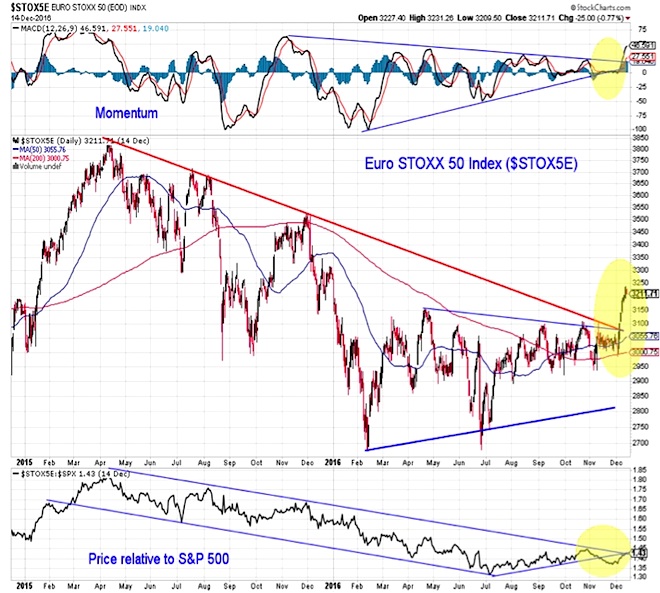
Divergences Continue To Fade – Confirmation of stock market strength is emerging in the form of wide rally participation. Even recent laggards have begun to get in gear. The Value Line Geometric Average is on the cusp of breaking through multi-decade resistance and Europe has broken above a persistent down-trend.
Market Breadth Improving, But Optimism Now Widespread – Confirmation can also be seen at the industry group and issue level. The percentage of industry groups in uptrends is expanding and the number of issues making new highs has surged. The caveat is that sentiment indicators show the emergence of excessive optimism as stocks have moved to new highs.
Copper Breaking Multi-Year Downtrend – Strength can be seen even beyond equities. What began as a breakout above short-term resistance for Copper has continued, with the multi-year down-trend line now having also been broken. Bond yields have also moved higher and the 10-year T-Note yield has moved to its highest level in more than two years.
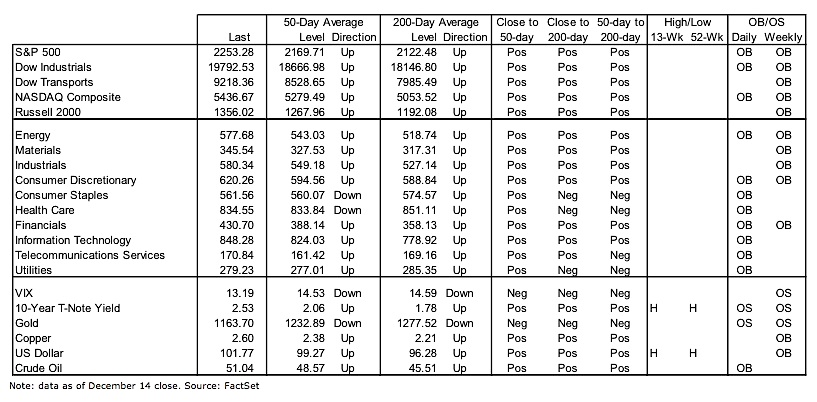
Stock Market Indicators
The Value Line Geometric Index, a proxy for the performance of the median stock, is one of the few broad domestic indexes that have yet to make a new high. Momentum has broken out to the upside and the index is now challenging its early-2015 peak. This actually represents a resistance level that has been tested several times over the past two decades. Getting through it now would help confirm the broad underlying support for the rally that can be seen elsewhere.
Conditions are improving overseas as well. The Euro STOXX 50 index has surged through down-trend resistance (which formed on multiple time frames), with price strength being confirmed by momentum. From a relative price perspective, however, the trends still favor the S&P 500 (U.S. leadership).
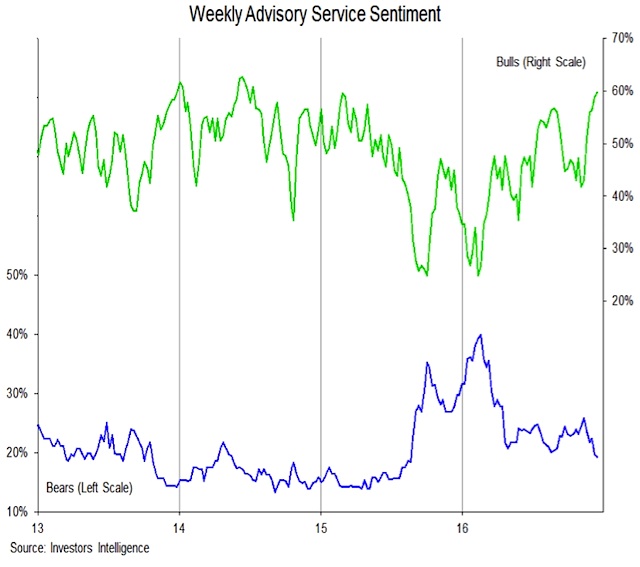
The rally to new highs has produced a surge in optimism this is evident across most sentiment indicators. Bulls on the Investors Intelligence survey are at their highest level in over two years. Bears have moved lower, but remain shy of the lows seen in 2014 and 2015.
Sentiment extremes themselves are not useful except as a signal of a potential reversal. If and when that reversal occurs, tactical investors can move against the crowd. From a timing perspective, optimism tends to linger longer than does pessimism (or conversely, pessimism tends to ramp then fade more quickly than optimism).
continue reading on the next page…


 Ready To Break Out?")
