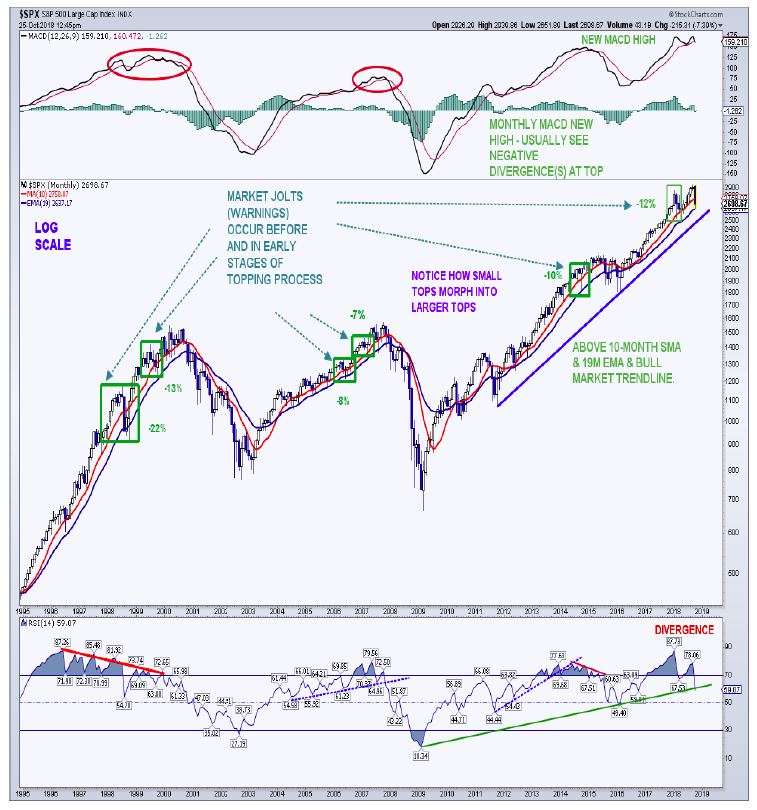
Typically, there are at least one if not a couple bearish divergences before a bull market peaks. The 14M RSI shows a clear divergent high and is testing key trendline support off the lows since 2009.
As we saw at the 2000/2007/2015 peaks, there is usually a market jolt, if not a couple, before the ultimate top. We did see one of these jolts early this year.
Is the current pullback another jolt before we run to new all time highs? Stay Tuned?
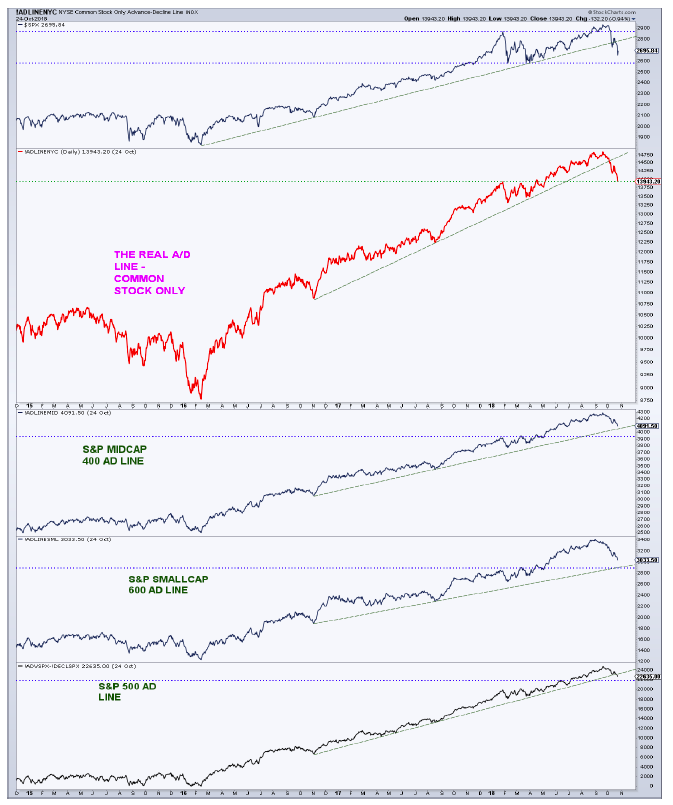
MARKET BREADTH: There has been some deterioration in market breadth since September. The NYSE common stock-only AD line and the S&P 500 AD line have broken their uptrend lines going back to November 2016, while the AD lines of the S&P MidCap 400, and S&P SmallCap 600 remain above trend line support. It is possible that the 4 AD lines are just pulling back to test their breakouts from earlier this year. There is some damage in market breadth, but not enough to hit the panic button.
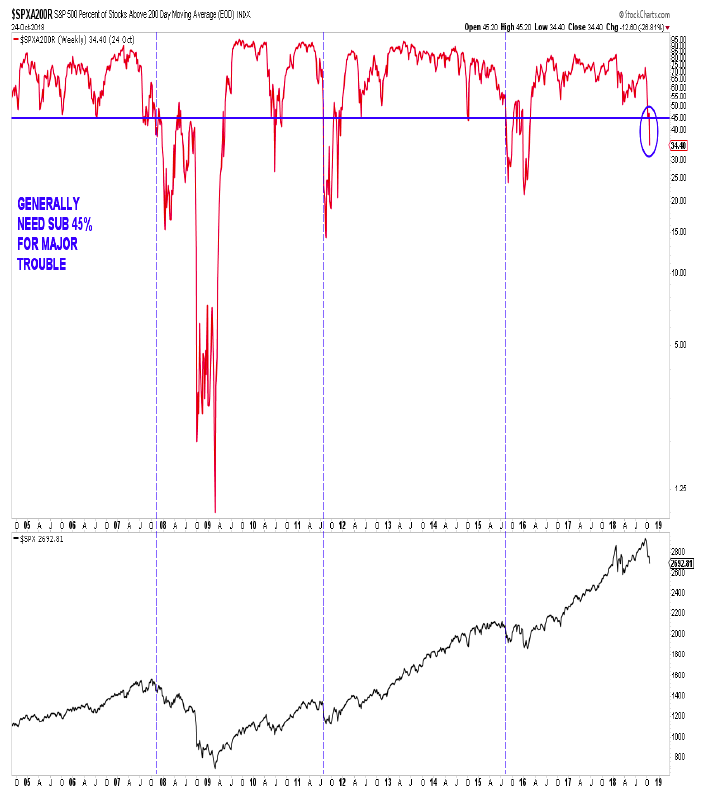
MARKET BREADTH PART 2: This weekly chart shows the percent of S&P 500 stocks that are above their 200-day average. The data only goes back to 2004, but we do have a bear market and some major corrections on it. The key takeaway is that the equity markets usually need to break down internally “before” any major correction or bear market takes place. Just eyeballing the chart, we generally need to see a sub-45% reading of “500” stocks above their 200-day. The current reading of 34% is in the danger zone, so a quick turnaround is needed or more price damage lies ahead. We are approaching oversold levels seen at some corrective lows (20% – 30%).
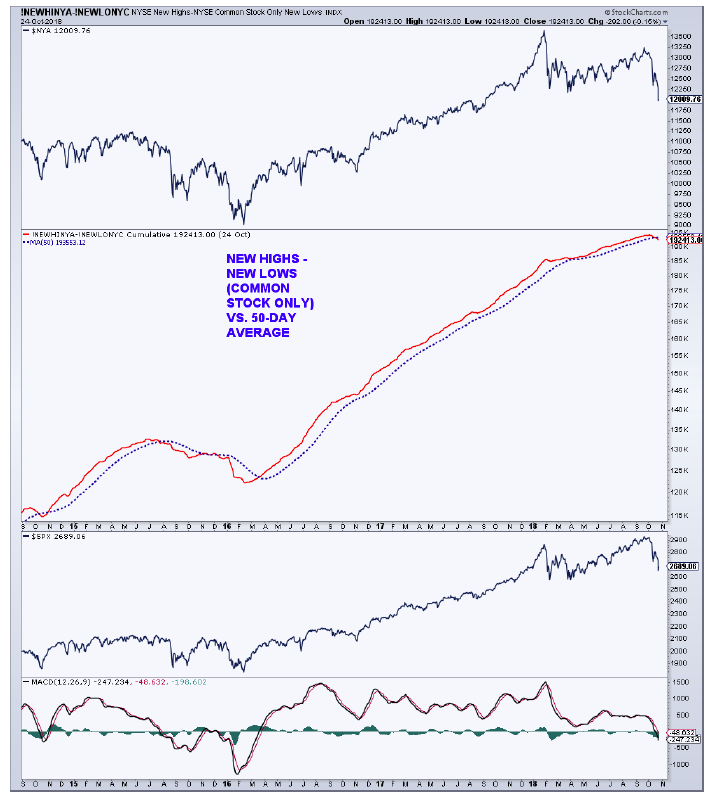
MARKET BREADTH PART 3: This is the AD line of new NYSE 52-week highs minus new NYSE 52-week lows (common stock only), plotted against its 50-day moving average. The AD line has recently broken below the 50-day for the first time since the summer of 2015, turning this key intermediate- to longer-term indicator bearish. While there are times that this indicator will give a false signal (especially during quick pullbacks/corrections from all-time-highs), we do not want see the indicator remain below the 50-day and accelerate to the downside from this point.
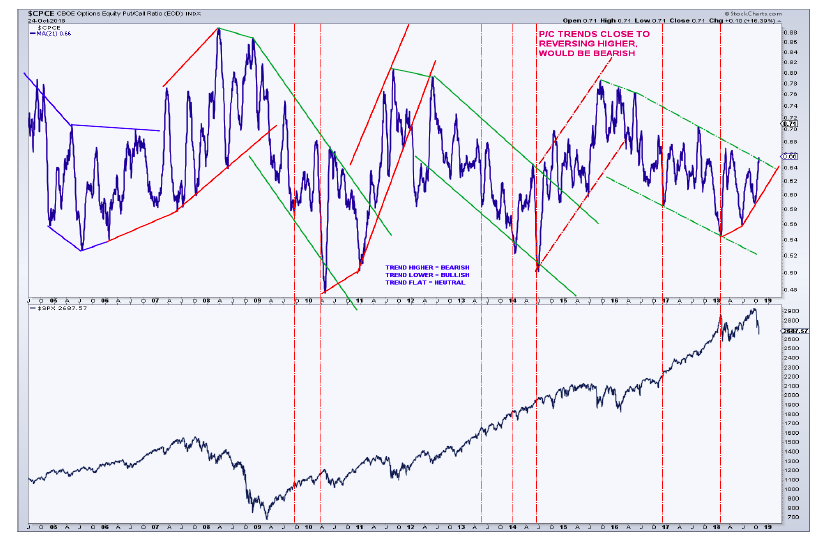
LONG-TERM MARKET SENTIMENT: 21-DAY CBOE EQUITY-ONLY PUT/CALL RATIO – Nearing breakout, a rising concern for stocks.
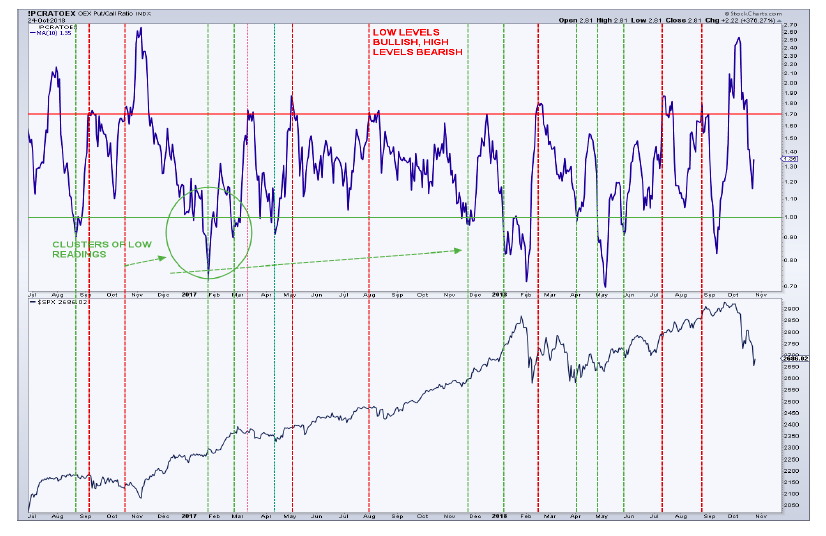
SHORT-TERM MARKET SENTIMENT: SMART MONEY INDICATOR – 10-DAY CBOE OEX PUT/CALL RATIO – Back to neutral after recent sell.
Feel free to reach out to me at arbetermark@gmail.com for inquiries about my newsletter “On The Mark”. Thanks for reading.
Twitter: @MarkArbeter
The author has a long position in Platinum at the time of publication. Any opinions expressed herein are solely those of the author, and do not in any way represent the views or opinions of any other person or entity.


: Showing Some Signs of Emerging Strength")
