The stock market, as defined by the S&P 500, has seen some technical damage from a near term perspective and some on an intermediate term degree.
As with many pullbacks/corrections, the bulk of the damage has been to individual stocks, individual sectors, and overseas markets. I have not seen enough damage here to declare that the bull market has ended, although there are some key warnings from some of my favorite charts and indicators.
Have we seen a clear washout from an internal/sentiment standpoint to see at least a good rally in the near term? Probably. If so, the dynamics of the next rally (how far it goes, the breadth makeup, the leadership) will go a long way in determining whether we reach 3,000+ on the index or if key lows down near 2,500 get breached first.
Volatility is here, at least in the next few weeks, so get used to the wild swings.
General Observations:
The Smart Money/Dumb Money Confidence Spread is up to +43%, the widest and most favorable spread since near the low in February.
The indicator was designed by www.sentimentrader.com. It attempts to show what the “good” market timers (smart money) are doing with their money compared to what the “bad” market timers (dumb money) are doing. Dumb money confidence has fallen to its lowest level since early 2016, a key market bottom.
Seasonally, we are entering the best time of year for stocks. Over the past 20 years, the “500” has risen in November and December 74% of the time. November returns have average 1.1% and December returns have averaged 1.2%.
Foreign markets remain a big concern with weakness seen all over the globe. Our concern remains with Germany, the U.K., and China.
10-year treasury yields have backed off to 3.14%. The yield curve remains (barely) positive while short rates have slowed their advance.
S&P 500 SHORT TERM:
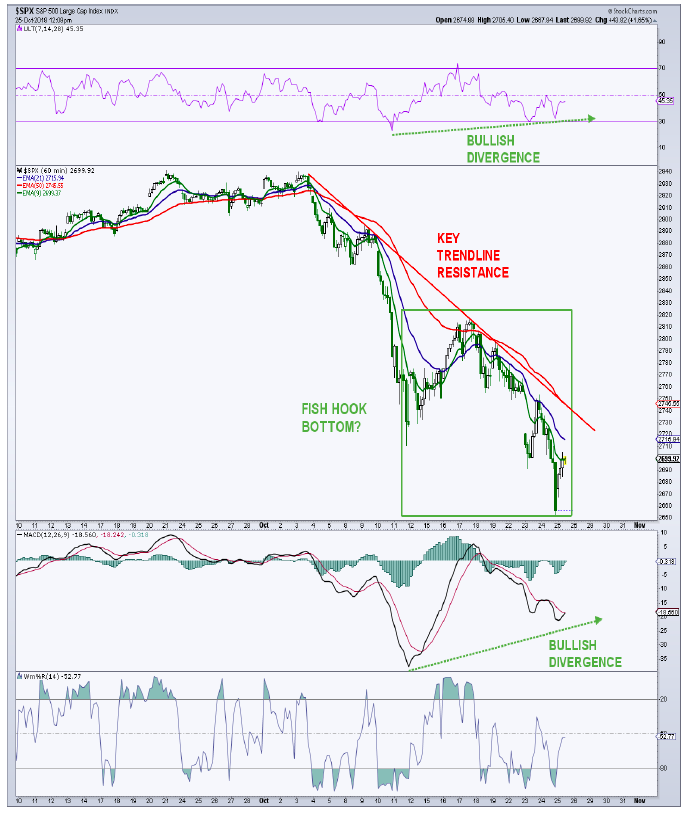
On the one-hour chart, the “500” may be tracing out a “fish hook” bottom. These patterns are seen quite frequently at intermediate-term bottoms. There is a nice bullish divergence on the hourly chart after cycling into oversold territory.
Key trendline resistance sits up in the 2,735 area with the prior high (initial chart resistance) up at 2,754. Both of these zones will need to be taken out to confirm a turn in the recent downtrend.
S&P 500 INTERMEDIATE TERM:
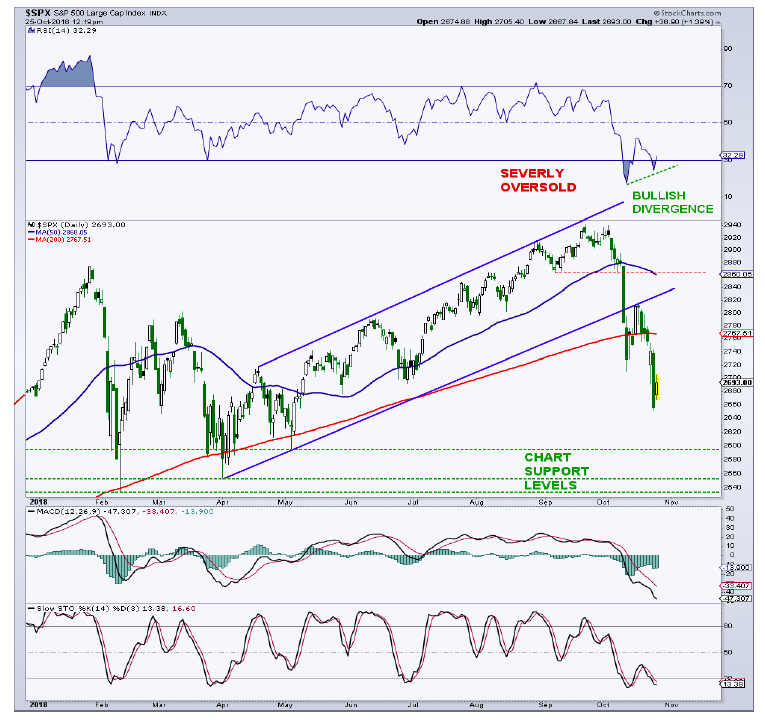
The daily chart shows the “500” nearing the lows from earlier this year. Those support levels come in between 2,533 and 2,595. It is possible that we saw “a” bottom on Wednesday as the index has already cycled into an extreme oversold condition and setup a bullish divergence with respect to the 14D RSI.
The 200-day average is ever so slowly rolling over, not a great sign, so it will be important to recapture this key moving average in the near term. Obviously, we do not want to see the index take out the February low as that would do great damage to the chart. Rallies from here, as well as general price action are likely to remain very volatile in the weeks ahead.
S&P 500 LONGER TERM:
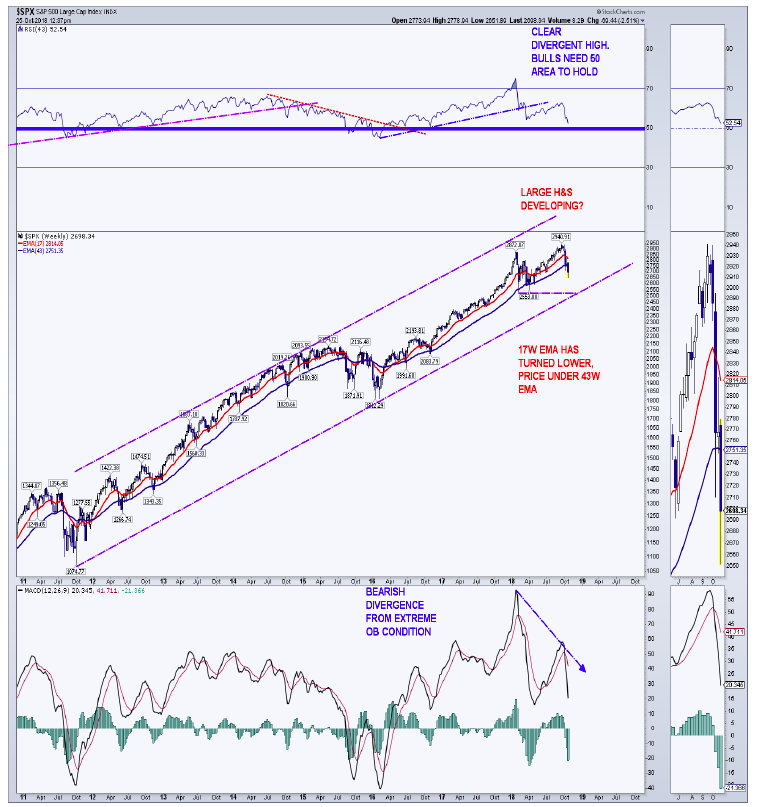
The S&P 500 weekly chart is showing some minor damage with the 17-week exponential moving average (EMA) turning lower and prices sitting underneath the 43W EMA. We saw clear divergent highs from the 43W RSI as well as the weekly MACD. A big reason for these divergences were due to the extreme price strength earlier this year and late last year. Whether this matters is still undetermined. The bulls want the 43W RSI to hold above the 50 region as major damage tends to occur underneath that area.
Longer-term trendline support, off the lows since 2011, as well as chart support from the February lows comes together when looking out into December. As I said, we do not want to see that area taken out from a longer-term perspective.
 S&P 500 LONG TERM:
The S&P 500 monthly chart remains bullish, however it does take time at major turns. The index has found support from its 19-month EMA while the bull market trendline remains intact. At the recent high, there was a monthly MACD high.
continue reading on the next page…

: Showing Some Signs of Emerging Strength")
