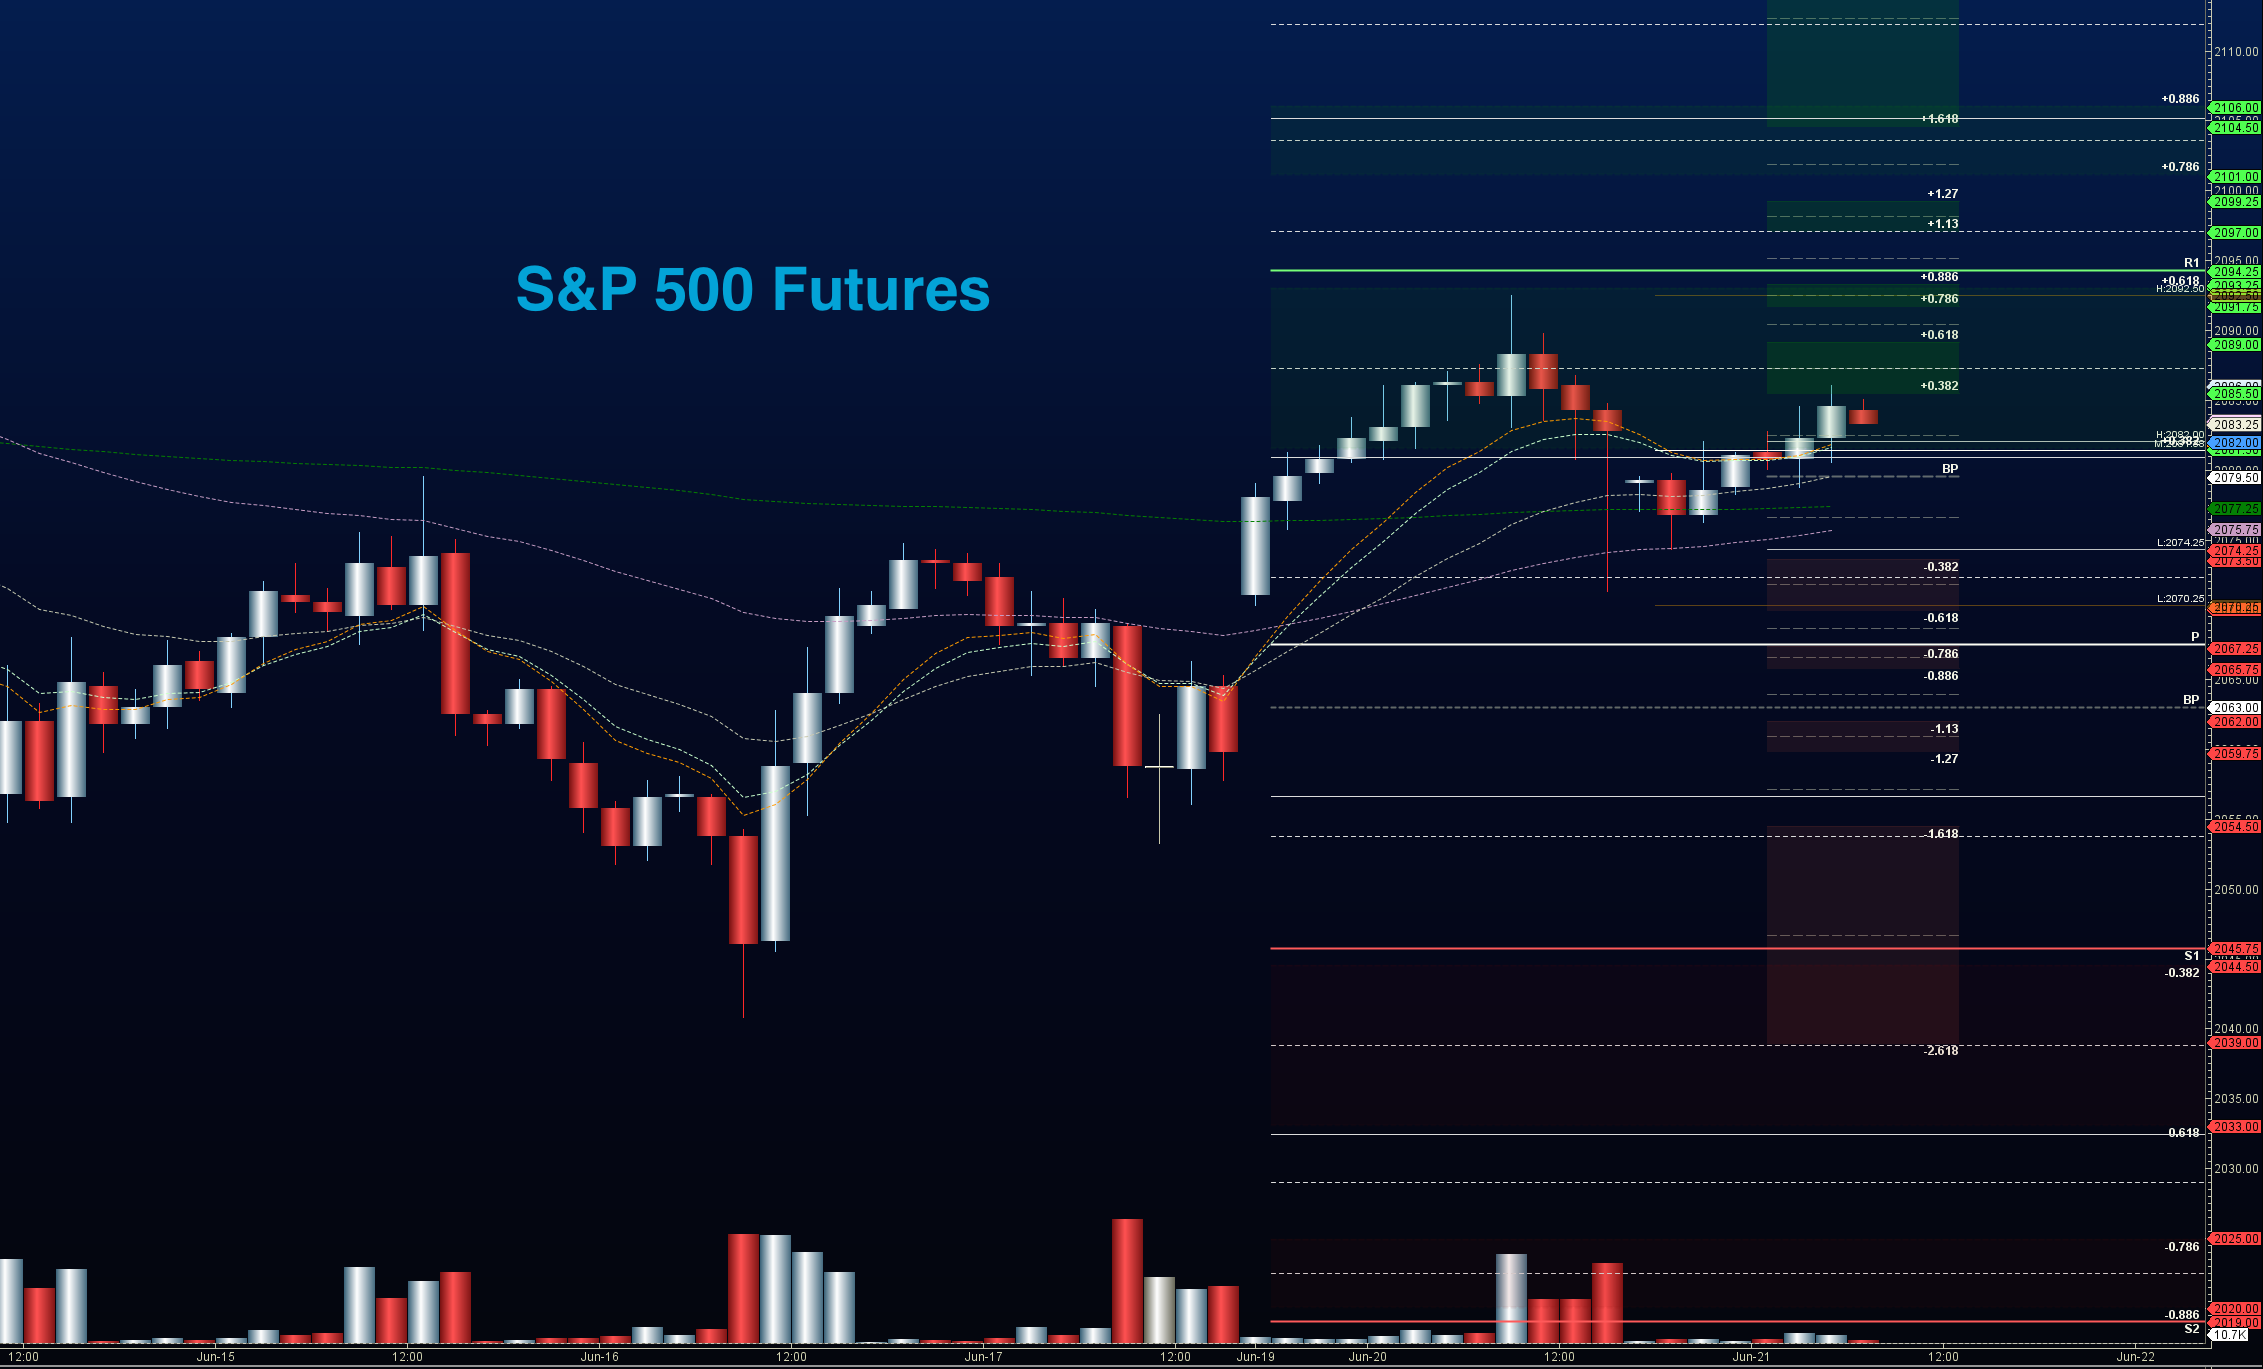
S&P 500 Futures Trading Outlook for June 21, 2016 (ES_F) – In S&P 500 futures trading, the charts continue to bounce showing higher lows, and a push to resistance for a second day. For lunar and cycle folks, today is the summer solstice. We will see the most sunlight of the year here in the US.
The charts still seem to be settling into a presumed failure of the EU referendum for Britain leaving on Thursday, Jun 23, 2016. Support levels look like the 2069.75 region, and a loss there would push us into filling the gap down into 2059.75. Resistance sits near 2086 to 2094.5. Bullish formations are now in charge at this time, but charts look fragile for yet another day. I would suspect that for today, just as yesterday, breakouts will certainly come back to retest areas of support. When in doubt, consider your trend, and trade with the trend. Lots of support sits near 2071 (then 2069.75) in S&P 500 futures trading today. Losing those levels would be quite bearish.
See today’s economic calendar with a rundown of releases.
RANGE OF TODAY’S MOTION
E-mini S&P Futures
S&P 500 Futures Trading Outlook for June 21, 2016
Upside trades on S&P 500 futures – Favorable setups sit on the positive retest of 2086.5, or a positive retest of 2079 with positive momentum. I use the 30min to 1hr chart for the breach and retest mechanic. Targets from 2079 are 2081.5, 2084, 2086.25, 2088.25, 2092.5, 2094.5, 2096.75, and perhaps 2098.25, and 2099.75 to 2104.5, if power remains with the buyers. We are sitting at another near term resistance area of 2086.5. Selling pressing in S&P 500 futures trading will likely accelerate below 2069.75, if it does not quickly recover off the test of the levels near 2071.
Downside trades on S&P 500 futures – Favorable setups sit below the failed retest of 2077.75 or at the failed retest of 2089.5 with negative divergence. It is important to watch for higher lows to develop with the 2089.5 entry, as the chart may be attempting recovery. Retracement into lower levels from 2089.5 gives us the targets 2086.5, 2083.25, 2081.25, 2078.75, 2075.75, 2073.25, 2071.25, 2068.5, 2066.5, 2064.5, 2061.75, 2060.25, 2058.75, 2056.75, 2053.5, 2051.5, 2047.5, and perhaps back to 2046.25, and 2041.5 – but that seems very unlikely at this time.
Have a look at the Fibonacci levels marked in the blog for more targets.
Nasdaq Futures
Nasdaq Futures Trading Outlook for June 21, 2016 (NQ_F) – Nasdaq futures have a significant resistance region near 4433. Support sits near 4392. The chart is trapped between moving averages on the composite weekly charts. Momentum is slightly neutral. And charts should remain choppy and rangebound into the EU vote in Britain.
Upside trades on Nasdaq futures – Favorable setups sit on the positive retest of 4421.5, or a positive retest of 4401.25 with positive momentum. I use the 30min to 1hr chart for the breach and retest mechanic. Watch for the lower high to develop in the long opening at 4401.25, as momentum may shift to sellers with the dip lower. Targets from 4401.25 are 4405.25, 4409.75, 4412.25, 4415.5, 4420.5, 4424.5, 4428.75, 4433.25, 4435.75, 4438.5, 4443.25, 4449.25, and 4454.5. Range expansions above 4454.5 could push us into 4476-4478.
Downside trades on Nasdaq futures – Favorable setups sit below the failed retest of 4409.5 or at the failed retest of 4432.25 with negative divergence. Buyers continue to successfully stage bounces off higher lows to keep the move upward going. Retracement into lower levels from 4432.25 gives us the targets 4429.75, 4424.5, 4420.5, 4415.5, 4412.25, 4409.75, 4405.5, 4401.75, 4397.25, 4394.5, 4389.5, 4384.75, 4378.75, 4384, 4378.75, 4374, 4367.75, and perhaps 4364.5.
Crude Oil
Crude Oil Trading Outlook for June 21, 2016 (CL_F) – Crude Oil prices are testing a support region between 49.02 and 49.2, and the API report looms after the close. We remain in elevated price levels due to disruptions in production still holding.
The trading range on crude oil suggests support action near 48.7, and resistance behavior near 50.24.
Upside trades on crude oil futures can be staged on the positive retest of 49.48, or at a bounce off 48.7 with positive momentum. I often use the 30min to 1hr chart for the breach and retest mechanic. Targets from 48.7 are 49.05, 49.24, 49.42, 49.64, 49.8, 49.95, 50.11, 50.24, 50.45, 50.56, 50.71, 50.9, and possibly 51.12 to 51.47, if production continues to be disrupted, and traders take advantage of the move.
Downside trades on crude oil futures can be staged on the failed retest of 49.01, or at the failed retest of 49.8 with negative divergence. These setups give us targets from 49.8 into 49.64, 49.48, 49.26, 49.12, 49.02, 48.75, 48.46, 48.24, 48.09, 47.97, 47.74, 47.48, 47.24, 46.89, 46.49, 46.24, 46.04, and perhaps 45.94 to 45.46.
If you’re interested in the live trading room, it is now primarily stock market futures content, though we do track heavily traded stocks and their likely daily trajectories as well – we begin at 9am with a morning report and likely chart movements along with trade setups for the day.
As long as the trader keeps himself aware of support and resistance levels, risk can be very adequately managed to play in either direction as bottom picking remains a behavior pattern that is developing with value buyers and speculative traders.
Twitter: @AnneMarieTrades
The author trades stock market futures every day and may have a position in mentioned securities at the time of publication. Any opinions expressed herein are solely those of the author, and do not in any way represent the views or opinions of any other person or entity.

: Worrisome to Broader Market?")


