S&P 500 Futures Trading Outlook for June 14, 2016 (ES_F)
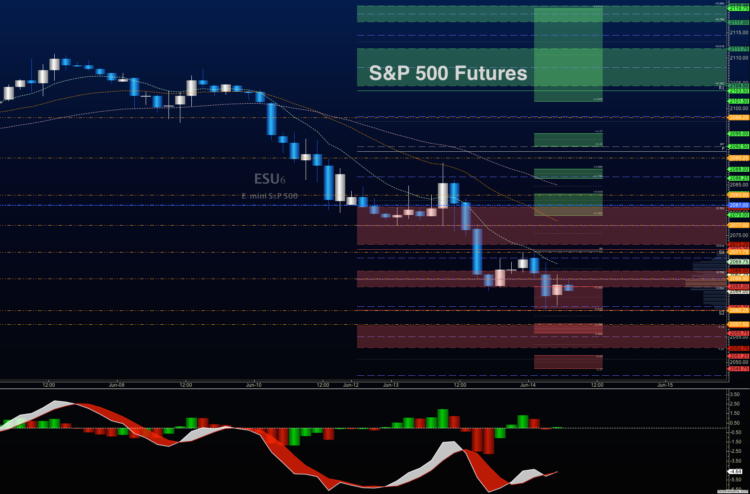
Charts dipped yesterday and that dip has held as we begin Tuesday, and the FOMC meetings begin. As a reminder, all classes of options expire this week. This environment usually sends us into at least one day of big volatility. And the EU referendum on Jun 23 for GB leaving the EU looms large in uncertainly. Support was broken yesterday, so we will look lower between 2054 and 2060.25 today. Resistance sits near 2074 to 2076.5. Bearish formations are still in charge at this time, so we must watch the key levels in today’s S&P 500 futures trading session.
See today’s economic calendar with a rundown of releases.
RANGE OF TODAY’S MOTION
E-mini S&P Futures
S&P 500 futures trading outlook for June 14, 2016 –
Upside trades on S&P 500 futures – Favorable setups sit on the positive retest of 2067.75, or a positive retest of 2060.5 with positive momentum. I use the 30min to 1hr chart for the breach and retest mechanic. Targets from 2060.5 are 2064.5, 2066.25, 2067.5, 2068.75, 2071.5, 2073.75, 2075.25, 2076.5, 2078.75, and perhaps 2081.5, and 2084.25, if power shifts to the buyers. We are sitting at another near term support area of 2061.75. Selling pressing will accelerate below 2060, if it does not quickly recover off the test of the level.
Downside trades on S&P 500 futures – Favorable setups sit below the failed retest of 2062.5 or at the failed retest of 2067.25 with negative divergence. It is important to watch for higher lows to develop with the 2067.25 entry, as the chart may be attempting recovery. Retracement into lower levels from 2067.25 gives us the targets 2064.75, 2062.5, 2060.25, 2058.75, 2056.75, 2054.5 and perhaps back to 2052.5, and 2046.75.
Have a look at the Fibonacci levels marked in the blog for more targets.
Nasdaq Futures
Trading outlook for Nasdaq futures for June 14, 2016 (NQ_F) – Nasdaq futures sits at a deeper level of support this morning, but with such negative readings, it suggests that bounces (certainly first bounces) will fail, and retreat before expanding further in a recovery attempt. Higher lows will give us the clue of strength returning, but so far, this has not occurred.
Upside trades on Nasdaq futures – Favorable setups sit on the positive retest of 4412.5, or a positive retest of 4394.25 with positive momentum. I use the 30min to 1hr chart for the breach and retest mechanic. Watch for the lower high to develop in the long opening at 4394.25, as momentum sits in favor of sellers this morning. Targets from 4394.25 are 4397.5, 4403.25, 4409.75, 4412.25, 4415.5, 4420.5, 4424.5, 4429.75, 4434.25, 4438.5, 4443.25, 4449.25, and 4454.5. Range expansions above 4454.5 are unlikely under the current momentum conditions.
Downside trades on Nasdaq futures – Favorable setups sit below the failed retest of 4412.25 or at the failed retest of 4420 with negative divergence. Buyers have tried to stage bounces several times off the lows of the day, but unable to hold. Retracement into lower levels from 4420.75 gives us the targets 4415.5, 4412.5, 4408.5, 4403.75, 4401.5, 4397.5, 4394.5, 4389.5, and perhaps 4384.75.
Crude Oil
Crude Oil trading outlook for June 14, 2016 (CL_F) – Crude oil charts are caught a bit sideways and bouncing off support levels in the current channel near 48. The API report is out after the close and the EIA report is out on Wednesday.
The trading range on crude oil prices suggests support action near 47.4, and resistance behavior near 49.59.
Upside trades on crude oil futures can be staged on the retest of 48.4, or at a pullback into 48.02 with positive momentum. I often use the 30min to 1hr chart for the breach and retest mechanic. Targets from 48.02 are 48.13, 48.24, 48.43, 48.64, 48.78, and 49.26 to 49.53.
Downside trades on crude oil futures can be staged on the failed retest of 48.16, or at the failed retest of 48.54 with negative divergence. These setups give us targets from 48.54 into 48.34, 48.14, 47.97, 47.75, and perhaps 47.68 to 47.24.
If you’re interested in the live trading room, it is now primarily stock market futures content, though we do track heavily traded stocks and their likely daily trajectories as well – we begin at 9am with a morning report and likely chart movements along with trade setups for the day.
As long as the trader keeps himself aware of support and resistance levels, risk can be very adequately managed to play in either direction as bottom picking remains a behavior pattern that is developing with value buyers and speculative traders.
Twitter: @AnneMarieTrades
The author trades stock market futures every day and may have a position in mentioned securities at the time of publication. Any opinions expressed herein are solely those of the author, and do not in any way represent the views or opinions of any other person or entity.


